Chapter 1. Why measure your performance?
Let’s begin by defining the role of an analytical laboratory and what key performance indicators (KPIs) actually are. An analytical laboratory functions as a critical service provider within a larger value stream, aiming to deliver accurate data necessary to support manufacturing, R&D pipelines, and external clients. A Key Performance Indicator (KPI) is a measurable value that indicates how effectively a laboratory is achieving a defined objective.
What happens in your laboratory affects both the upstream and downstream activities of your stakeholders. Upstream might include procurement, manufacturing, or R&D activities. Downstream includes logistics, packaging and your clients. If your laboratory only thinks about optimizing the performance of your laboratory without thinking of the whole value stream, you aren’t bringing your clients the value you think you are.
What do I mean by this? Let’s look at three examples where only parts of the value stream are optimized:
Example 1: Our HPLC utilization is only 40 %. To maximize this, we should wait two more days before analyzing anything so that we can fill the entire autosampler with samples. This will give us significant cost savings due to using less standards and reagents.
Example 2: Our production schedule is late due to a delay of a critical raw material delivery. As such, our laboratory is ordered to prioritize and rush through the analysis the same day it arrives in the laboratory. We know the sample requires a challenging sample preparation step with higher than usual chance for laboratory errors.
Example 3: We focus on maximizing productivity by dedicating our analysts to different techniques: analyst A only runs HPLCs, analyst B only runs titrators, analyst C only GC. This will ensure our runs are fast, accurate and efficient.
What is the issue with these three examples?
In Example 1, we’re focusing on improving our HPLC utilization rate, which will negatively affect our laboratory turnaround time. Let’s say Sample A arrives on Monday, Sample B arrives on Wednesday, and Sample C arrives on Friday. By waiting until Friday, you have just let Sample A sit on the shelf for four days and Sample B for two days. Now, let’s imagine the worst happens and your analysis on Friday indicates an OOS result: you have just lost valuable time for your OOS investigation, and your QA department and clients are understandably frustrated. Even without an OOS result, the results for Sample A are reaching QA at least four days later than they could have.
In Example 2, we are sacrificing process stability for speed, ignoring how a rushed workflow increases the risk of human error. When an analyst is under pressure to rush through a multi-step sample preparation requiring focus and care, it is much more likely that a pipetting error or incomplete dissolution slips through. In the worst case, the mistake is only discovered during QA review, forcing you to start a nonconformity investigation and perform various experiments to prove it was a laboratory error rather than a faulty product. Your attempt to save a few hours has now cost your company several days, leading to poor client satisfaction.
In Example 3, we are prioritizing individual task efficiency at the expense of whole-team flexibility. Let's say a sudden rush of manufacturing samples lands in the lab, all requiring extensive HPLC testing. Because you have siloed your staff, Analyst A instantly becomes a bottleneck. The situation is even worse if Analyst A is unexpectedly absent due to illness or injury. Meanwhile, Analysts B and C sit idle or work on non-urgent tasks because they lack the training to step in and help process that urgent workload. By focusing only on making individual people look busy rather than keeping samples moving through the laboratory, you have destroyed your lab's ability to handle the natural variability of laboratory work, ultimately increasing the total lead time for your client.
This is why partial optimization never works: optimizing one part of the value stream often makes the performance of the whole system worse.
So how do you know whether you're making the right decisions when trying to improve your laboratory's performance? The answer lies in how you design your KPIs and, more importantly, how you pair them.
When you look at a single metric by itself, it creates a massive blind spot. If you only measure speed, people will sacrifice quality to hit the target. If you only measure utilization or cost, you will end up building large sample backlogs. In a Lean laboratory, a metric should never stand alone. To prevent partial optimization, you need to introduce the concept of paired KPIs. This means that whenever you choose a metric that drives operational speed or efficiency, you must immediately pair it with a counterbalancing quality or stability metric. For example:
If you track how fast you release a batch, you must also track whether the test was completed without errors on the first try. This ensures that analysts don't rush through complex sample preparations just to meet the deadline.
If you want to monitor your instrument usage (Example 1), you must balance it against how long samples are sitting on the shelf. This stops the laboratory from hoarding samples just to make the HPLC look busy while the business down the hall grinds to a halt.
By pairing your KPIs, you force the system to optimize the entire value stream rather than one isolated benchmark. You create a natural tension that keeps your laboratory fast, compliant, and genuinely valuable to your stakeholders.
In the next chapter, we will dig deeper into the essential KPIs and explain how you can easily start building the foundation for these metrics by utilizing simple timestamps.
Chapter 2. Implementing metrics and KPIs with simple timestamps
No matter which KPIs you choose for your laboratory, you need to collect the data necessary to monitor them. To collect that data, you must first understand which information creates value for both your stakeholders and your laboratory.
Let’s begin by defining three essential KPIs for any laboratory.
Turnaround Time (TAT): The time it takes for your laboratory to complete the requested analyses for a single product or batch. Typically measured in days.
On-Time Delivery (OTD%): The percentage of batches completed within the targeted turnaround time.
Right First Time (RFT%): The percentage of analyses completed correctly without nonconformities or deviations caused by work performed in your laboratory.
These KPIs are powerful, but they are incomplete on their own. For example, TAT and OTD help determine how well your laboratory meets the expectations of its stakeholders, but they do not explain why performance is improving or deteriorating. They also have one important weakness: they are lagging indicators. They tell you what has already happened.
Let’s imagine you have set your laboratory's OTD target at 80%. If 80% of your analyses are completed within the target turnaround time, your laboratory is meeting its performance objective. However, the following month you collect your data and discover your OTD has dropped to 59%. Your next question naturally becomes why did this happen, and how do we get back on track?
To answer that question, let’s introduce two powerful metrics based on Little’s Law.
Throughput: The number of analyses or batches your laboratory completes during a chosen time period (day, week, or month).
Work in Progress (WIP): The number of analyses currently waiting to be analyzed or actively being processed in your laboratory. In other words, the amount of work currently inside your laboratory system.
Throughput tells you how much work your laboratory is actually completing over time. WIP will tell you your workload or the queue you have in your laboratory. Before we continue, however, let's first look at how these metrics and KPIs are collected. Fortunately, it all comes down to simple yet powerful timestamps.
Turnaround Time: Collect the date and time when a product or batch is received in the laboratory, and the date and time when all required analyses have been completed and the results reported. These timestamps can be collected manually, but ideally they should be generated automatically by your laboratory information management system or enterprise resource planning system . For example, if a sample arrives on Monday and the results are reported on Friday, the turnaround time is five days.
On-Time Delivery: Count the number of batches completed within the target turnaround time. For example, if 80 out of 100 batches are completed within the target TAT of seven days during June, your OTD is 80%.
Right First Time: Determine how many batches were completed without laboratory errors during a chosen period. This requires tracking the number of laboratory errors or deviations alongside the total number of completed batches. For example, if your laboratory completed 95 batches without laboratory-caused errors out of a total of 100 completed batches during June, your RFT for June was 95%.
Throughput: Simply count the number of batches completed during your chosen time period (day, week, or month).
Work in Progress: Track the number of batches currently waiting or actively being processed in the laboratory. Ideally, this metric should be monitored frequently. For eaxample, weekly or even daily, to detect sudden increases in workload before they begin affecting laboratory performance.
Suppose you review your KPIs only once every month and discover your OTD has fallen to 50%, even though your target is 80%. By the time you communicate the results, discuss them with stakeholders, and develop a corrective action plan, the problem has already occurred. Your laboratory is already overloaded, WIP has accumulated, analysts are working overtime, and stress levels are rising.
This is why Throughput and WIP are such valuable operational metrics. They provide an earlier indication that the laboratory is becoming congested before TAT and OTD begin to deteriorate. Because of this, they should be monitored more frequently. For example, if TAT and OTD are reviewed monthly, Throughput and WIP should ideally be reviewed at least weekly or even daily in laboratories with high sample volumes.
How do you choose KPI targets?
The first step is to define the target turnaround time for your laboratory process (for example, seven days). This target should be established together with your key stakeholders and based on the needs of your business or clients. At the same time, the target must reflect the actual capability and capacity of your laboratory. After all, no laboratory can consistently achieve impossible targets, and there is nothing less motivating than KPIs that cannot realistically be met. Keep in mind that your stakeholders would likely prefer every sample to be completed exactly when needed. In reality, this is rarely achievable. Equipment failures, analyst absences, unexpected investigations, and other unavoidable disruptions will always occur. Always plan to have some extra capacity. Your long-term objective should be continuous improvement toward 100% OTD. However, this should be viewed as the long-term vision. Not necessarily the initial target for a laboratory implementing KPIs for the first time.
Now, let’s imagine we have established a TAT target of seven days and an OTD target of 80%. Next, we need to balance these objectives with RFT to ensure analytical quality is not sacrificed. Remember, KPI design is always a balancing exercise. If you set your RFT target at 100%, analysts will naturally become extremely cautious. While quality may improve, this will likely have a negative impact on TAT and OTD. On the other hand, if you set an RFT target of only 70% while expecting an OTD of 98%, analysts may feel pressured to prioritize speed over quality. This can significantly increase laboratory errors, nonconformities, and investigations, creating even more work for the laboratory. Ironically, the additional investigations may reduce throughput even further, causing delays throughout the supply chain and ultimately leading to dissatisfied clients.
Remember the fundamental purpose of KPIs: to maximize the performance of the entire value stream, not just the laboratory.
Once you have selected your laboratory's metrics and KPIs, the next step should be establishing a baseline. Before implementing improvement initiatives, collect historical data to understand your laboratory's current performance. Without knowing where you started, it is impossible to objectively measure whether your improvements have actually created value.
Chapter 3. Understanding when to react
Let’s imagine a concrete example. Below, you can see your laboratory throughput and Work in Progress (WIP) over a period of three weeks.
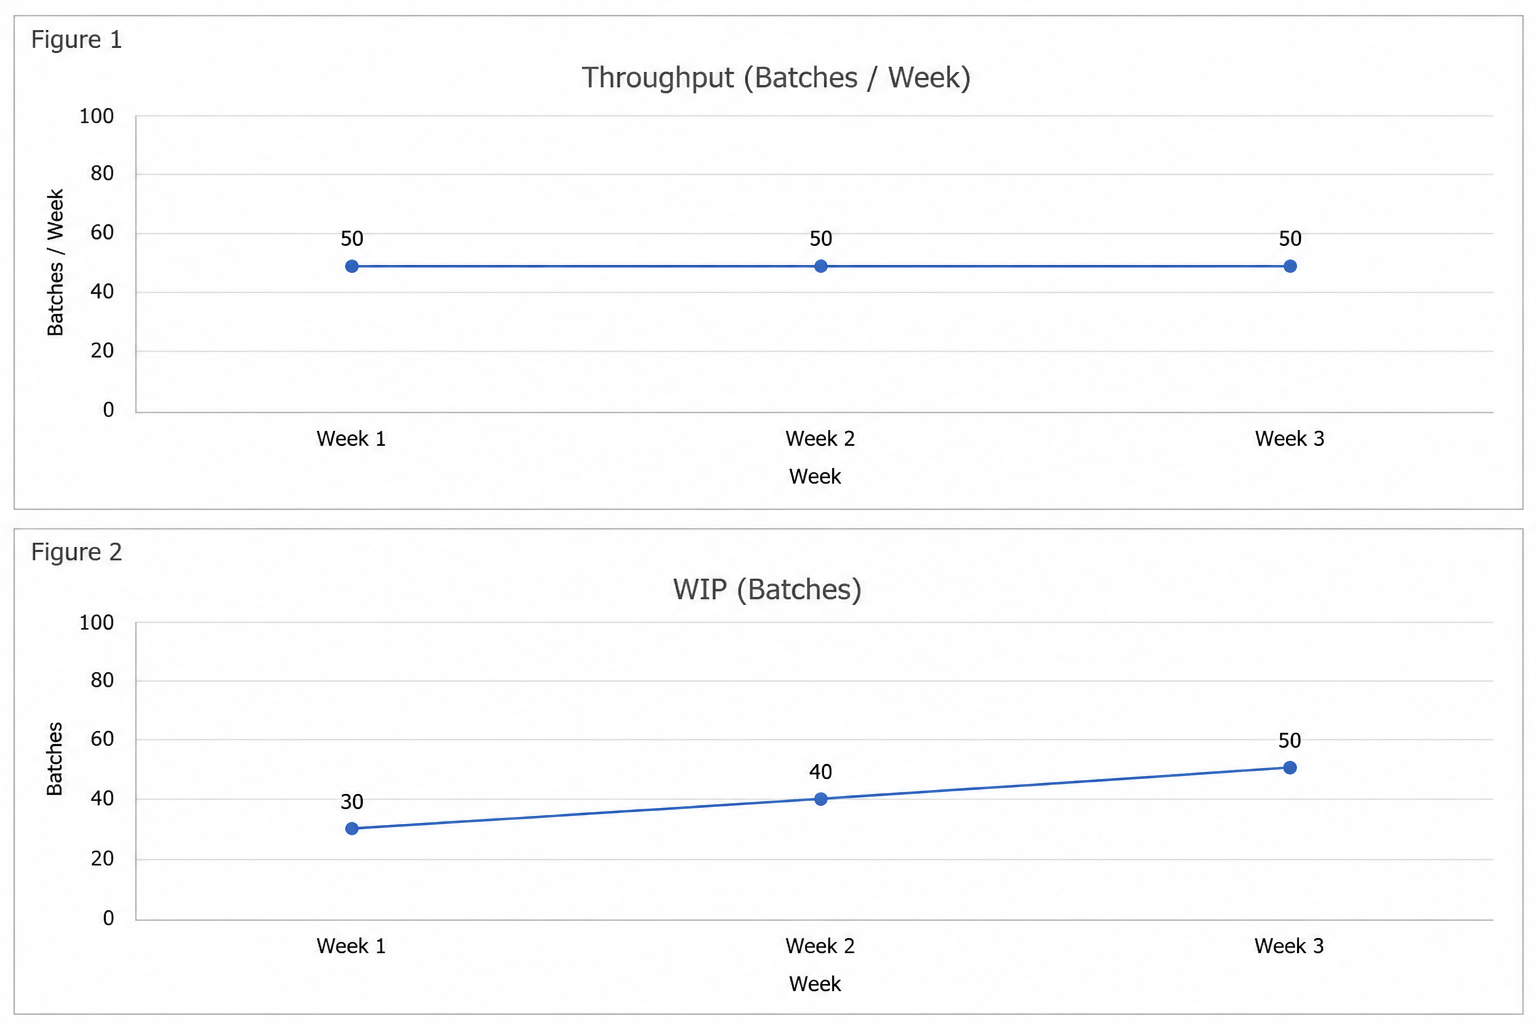
Notice that neither TAT nor OTD has been considered yet. We are simply monitoring the operational health of the laboratory using Throughput and WIP. You look at your WIP from the past three weeks and notice a clear trend: your throughput has remained constant at 50 batches per week, yet your WIP continues to increase by 10 batches every week.
This is why these two metrics should always be interpreted together. If you only look at throughput, everything appears to be fine. If you only look at WIP, you know that work is accumulating, but you have no idea why. Together, however, they tell a much more meaningful story.
In this example, throughput remains constant while WIP continues to rise. This tells us that the laboratory is becoming increasingly congested. There may be several contributing factors, but the most likely explanation is that incoming demand is exceeding the effective capacity of the laboratory. The challenge is therefore not simply to increase output. Instead, the goal should be to understand how the laboratory can sustainably meet demand. KPIs are merely tools for visualizing what is happening inside the process.
As a general rule, high WIP is a symptom of poor flow, not the root cause of the problem. Reducing unnecessary WIP improves process flow, shortens turnaround times, and makes laboratory performance more predictable. Whenever you review your laboratory performance, ask yourself one simple question: what level of WIP can our laboratory sustain while consistently meeting our TAT and OTD targets? That level represents the practical operating capacity of your laboratory. Ideally, it is the point where your laboratory consistently meets its TAT and OTD targets without creating excessive stress, overtime, or unnecessary queues.
Now, let’s continue the example shown in Figures 1 and 2.
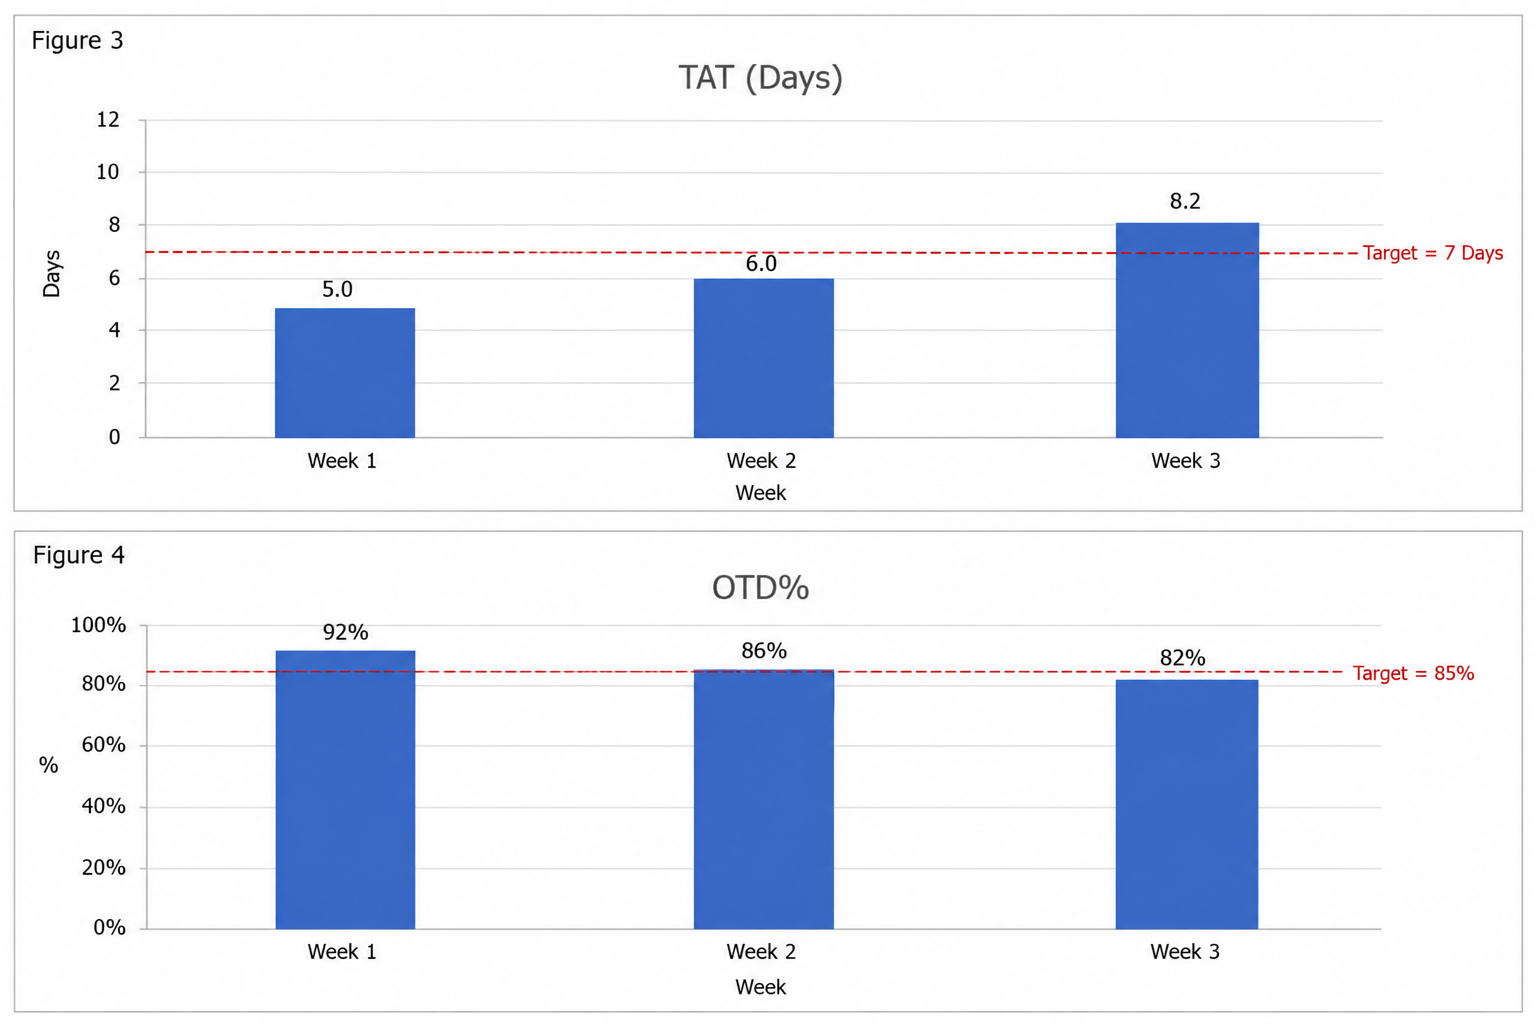
Your laboratory output has remained stable, yet WIP continues to increase. You notice this trend, but you don’t react. Then, at the end of the month, you review your TAT and OTD data and recognize a concerning conclusion in Figures 3 and 4.
What does this tell us?
It tells us that the average turnaround time has steadily increased from Week 1 to Week 3, while the percentage of batches delivered on time has declined every week. This is an alarming finding because it tells us we have already reacted too late.
Ideally, we would have identified the increasing WIP before it began affecting our customer-facing KPIs. Instead, the rising WIP was allowed to accumulate until it eventually translated into longer turnaround times and poorer on-time delivery. The laboratory is now operating in a reactive mode. Analysts are under increasing pressure, priorities are constantly changing, and improvement efforts become focused on recovering from delays instead of preventing them.
The key lesson from Figures 1–4 is simple: WIP is often the earliest warning sign that laboratory performance is beginning to deteriorate. By monitoring Throughput and WIP frequently, you can detect congestion long before TAT and OTD begin to fall outside their targets. This allows you to investigate the root causes and take corrective actions while the laboratory is still operating under control. In our example, WIP has gradually increased until it began negatively affecting the laboratory's key performance indicators. The laboratory is rapidly becoming the bottleneck in the value stream.
In Chapter 4, we will discuss practical Lean principles for bringing the laboratory back under control and preventing the same situation from occurring again.
Chapter 4. Acting upon your data
To act properly on our data according to Lean principles, we should remind ourselves of the Little’s law:
WIP = Throughput x Lead Time (turnaround time)
If our laboratory completes 50 batches per week, and our average WIP remains constant at 100 batches, our average turnaround time will be approximately 2 weeks. What does Little’s Law tell us?
If our WIP keeps increasing while throughput remains the same, our turnaround time will increase.
If we reduce WIP while maintaining the same throughput, our turnaround time will decrease (Improvement 1).
If we increase throughput while keeping WIP constant, our turnaround time will also decrease (Improvement 2).
The greatest improvement occurs when we both reduce WIP and increase throughput.
Our objective is therefore clear: reduce WIP and increase laboratory throughput. Let's first focus on reducing WIP, and then on increasing throughput. Soon you'll see why.
Step 1: Limit your WIP
Your first step is to limit the amount of WIP in your laboratory. There are several ways to accomplish this, but two common approaches are: (1) slowing the release of work into the laboratory so that WIP remains at a controlled level, and (2) implementing a controlled sample release system, where new samples are added to the laboratory worklist only when the WIP falls below a predefined limit.
At first glance, both approaches seem counterintuitive. The first option, in particular, can be extremely difficult to explain to the rest of the value chain because it requires a thorough understanding of Lean principles. The figure below helps illustrate why.
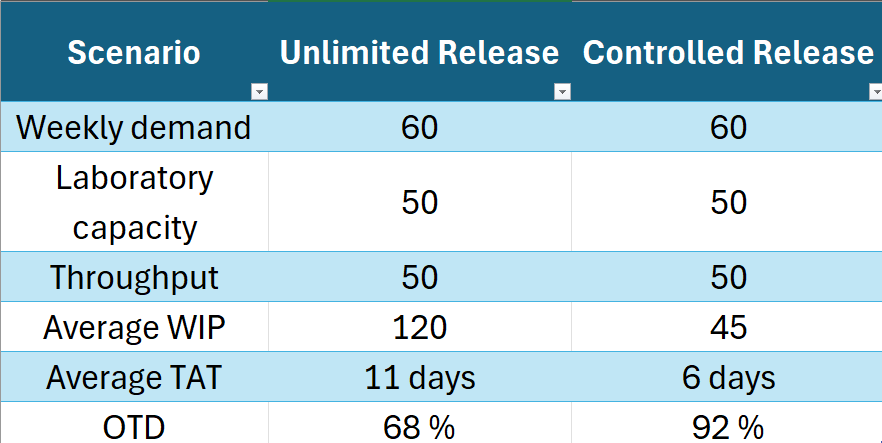
Whether work is released without restriction or through a controlled release system, one fact remains unchanged: the laboratory can only complete work at the rate allowed by its bottleneck. If incoming demand exceeds laboratory capacity, throughput does not increase. Only WIP does. As WIP increases, turnaround times become longer, deliveries become less predictable, and more time is spent on prioritization, scheduling, and firefighting. Output becomes increasingly uneven, making it difficult to predict when individual batches will be completed.
Ironically, customers receive the same number of completed batches in both scenarios. The difference is that one laboratory operates with stable flow and predictable delivery, while the other is overwhelmed by unnecessary queues. Controlling WIP provides another important benefit: it makes it easier to identify the laboratory's true bottleneck. When WIP becomes excessive, every process appears to be overloaded. You hear that there are not enough analysts, not enough HPLCs, not enough reviewers, and not enough time. Everything appears to be the problem. Reducing WIP removes much of this noise, allowing the true constraint to become visible instead of being hidden behind congestion.
This is why WIP should be reduced before attempting to increase throughput. A stable system allows you to identify the real root cause of the bottleneck and focus improvement efforts where they will have the greatest impact.
Step 2: Find the Bottleneck and Improve it
Every laboratory has one resource that determines its overall capacity. This is because the capacity of a laboratory is determined by its slowest process. Not its fastest. That bottleneck may be:
A laboratory system or piece of equipment
The number of analysts available to perform testing
The number of personnel available to review and approve data
Sample preparation capacity
A specialized analytical technique (e.g., HPLC, GC, LC-MS, dissolution, or microbiology)
A support function, such as reagent preparation or sample receipt
When improving laboratory performance, it is important to recognize two realities: (1) eliminating one bottleneck simply creates the next bottleneck elsewhere in the process, and (2) Improving anything that is not the bottleneck will have little impact on the overall performance of the laboratory.
Finding the bottleneck can be the challenging part. If your laboratory has strong data collection practices and performance dashboards, identifying the constraint may be relatively straightforward. Otherwise, you may need to rely on expert knowledge, process observations, or targeted data collection. The approach depends largely on how well you understand your laboratory's workflow.
When investigating the root cause, remember one fundamental Lean principle: stable processes create stable flow. Lean aims to reduce unnecessary variation and improve flow throughout the value stream. One of the most effective ways to achieve this is by standardizing routine work wherever possible. Generally, waiting is one of the largest sources of waste in analytical laboratories, and reducing waiting time often has a significant impact on turnaround time.
Common examples include:
Waiting for analytical instruments or laboratory equipment to become available.
Waiting for sample preparation, incubation, or instrument equilibration to finish.
Waiting for another department to transfer information or documentation.
Waiting for analyst or reviewer availability.
Waiting for data review or approval before results can be released.
Waiting because samples are processed in large batches instead of flowing continuously through the laboratory.
Remember that value is defined from the customer's perspective. Waiting does not create value. Your primary objective should therefore not be to make analysts work faster, but to eliminate or reduce the non-value-adding time between analytical activities.
Now let's return to Step 1: finding the bottleneck and implementing a permanent solution takes time.
Suppose your investigation concludes that HPLC capacity is the laboratory's true constraint. Hiring additional analysts will not solve the problem if there are no available HPLCs for them to use. Likewise, purchasing another instrument involves procurement, installation, qualification, validation, and training before it begins creating value. For this reason, reducing WIP is often the most effective short-term action while longer-term improvements are being implemented. Of course, every laboratory is different.
Suppose your forecasts indicate that the increase in WIP is temporary because of seasonal demand or production campaigns. In that case, permanently increasing headcount or purchasing additional instruments may not be the best decision. Instead, focus on the bottleneck. For example, imagine that every laboratory resource has spare capacity except analytical staff. Rather than hiring permanent employees, you might cross-train generalists who can temporarily support analytical work whenever a predefined WIP threshold is exceeded. This allows the laboratory to temporarily increase throughput while maintaining stable turnaround times during predictable workload peaks.
The key word, however, is temporary. If elevated WIP becomes the new normal, the underlying capacity constraint must eventually be addressed through permanent process improvements rather than temporary workarounds.
Chapter 5. Final thoughts
In this arcticle, we have discussed the imporance of KPIs, and how to act upon them. Next, I want to remind us of the actual purpose of KPIs. And it is not only to tell you how well your laboratory is doing: the purpose of proper KPIs is to tell you when to act. This is where the imporance of leadership comes in. With every imporant metric, you should create a standard process with an actual predefined response. What do I mean by this? Perhaps this table will help with illustrating the point across:
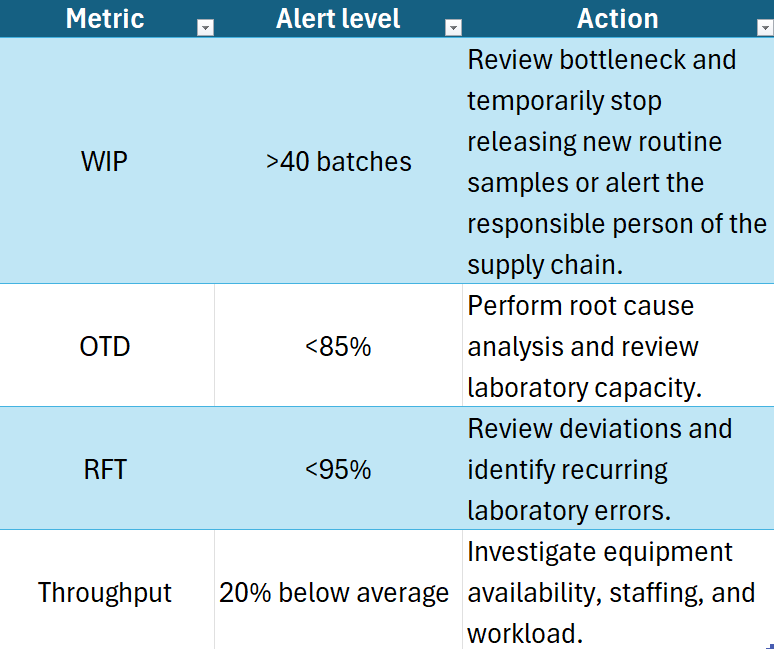
If you know that your laboratory bottleneck is the number of analysts during temporary WIP peaks, you should have a predefined threshold when your temporary cross-trained generalists can jump in to help with the workload. In more permanent cases, you should have a clear process on how to act. In any case, you should have clear alert leves when the laboratory actually reacts.
Due to the leading metric nature of WIP, it provides a clear opportunity to intervene before your laboratory becomes a bottleneck and affects customer performance negatively. Ideally, WIP shouldn’t be your only indicator: your laboratory should have visibility to forecasts and customer demand. This can give you valuable insights into more drastic performance improvement needs that require more rigorious planning and executing.
Additionally, always keep in mind that alert limits are different in every laboratory, and only your own historical data can answer this question. All in all, your laboratory performance dashboard should answer these three questions:
Are we operating normally?
If not, why?
What should we do about it?
To conclude this article, I think it is important to circle back to the purpose of an analytical laboratory. The goal is to build a laboratory that delivers reliable analytical results to its customers with predictable quality and predictable turnaround times. If your KPIs help you achieve that goal, and more importantly, prompt your laboratory to take the right actions when performance begins to deteriorate, then they are serving their true purpose.
Sources and further reading:
[1] Earley, J.A.A. (2016) The lean book of lean: a concise guide to lean management for life and business. Chichester: John Wiley & Sons.
[2] Parmenter, D., 2010. Key Performance Indicators: Developing, Implementing, and Using Winning KPIs. 2nd ed. Hoboken, NJ: John Wiley & Sons.
[3] Graban, M. and Padgett, S., 2008. Lean Laboratories: Competing with Methods From Toyota. Laboratory Medicine, 39(11), pp.645–648. https://doi.org/10.1309/LMX0LEMR7R0USKUM. Accessed: 5th July 2026.
[4] Villa, D., 2010. Automation, Lean, Six Sigma: Synergies for Improving Laboratory Efficiency. Journal of Medical Biochemistry, 29(4), pp.339–348. https://scindeks.ceon.rs/article.aspx?artid=1452-82581004339V&lang=en. Accessed: 5th July 2026.
[5] Hawkins, R.C., 2007. Laboratory turnaround time. The Clinical Biochemist Reviews, 28(4), pp.179–194. Available at: https://pubmed.ncbi.nlm.nih.gov/18392122/. Accessed: 5th July 2026.
The visualizations in this article were generated using user prompts by ChatGPT based on the factual content in the article.
