Modern AI Tools for Laboratory Process Improvement: A Practical Guide
In this article, I will dig deeper into the use of modern AI tools for laboratory procees improvement using Lean Six Sigma methodology. I will begin by explaining what Lean Six Sigma is and what I mean by modern AI tools. We will then move into the current state-of-the-art options available in this rapidly changing digital age. I will also give you an example of how to set up your very own AI Lean Six Sigma Black Belt Agent to help you turn raw data into actionable insights. We will then perform a process improvement demonstration with our new AI Agent.
Let’s get going!
Chapter 1. What is Lean Six Sigma?
Let’s begin by defining what Lean Six Sigma actually is. You may have heard these terms used together or separately. While they are often grouped, they focus on solving two different fundamental problems:
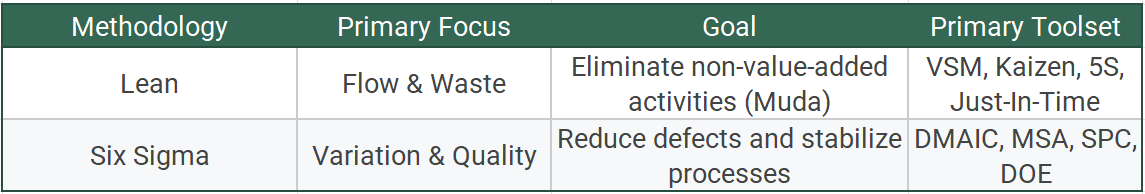
Together, these approaches are complementary: Lean provides velocity, while Six Sigma provides precision. Lean identifies the waste that slows a system down, while Six Sigma identifies the variation that makes a system unpredictable. Lean focuses on creating flow and eliminating non-value-adding activities, while Six Sigma focuses on reducing variation and improving quality. Lean minimizes lead time and waste, while Six Sigma minimizes variation and the resulting defects per million opportunities.
In the world of quality management, Six Sigma is a rigorous statistical benchmark. It represents a process that produces no more than 3.4 defects per million opportunities (99.99966% long-term yield) under long-term operating conditions.
This level of performance is achieved by designing a process so that the mean sits six standard deviations away from the nearest customer specification limit. In practice, Six Sigma assumes that processes may drift by approximately 1.5 standard deviations over time, which results in the well-known 3.4 defects per million opportunities. This is considered the gold standard for high-stakes, precision-critical operations such as aviation, semiconductor manufacturing, or clinical diagnostics.
Many traditional businesses mistakenly aim for a 3-Sigma level, believing that 99% accuracy is good enough. However, real-world conditions are rarely perfect. Due to long-term process drift caused by wear, environmental changes, or operator differences, a process that looks good on day one can degrade quickly. To put that into perspective:
Short-term: Right after implementation, a 3-Sigma process has 99.73% accuracy (2,700 defects per million opportunities).
Long-term: After a 1.5-sigma shift, that same process drops to 93.32% accuracy (66,807 defects per million opportunities).
A 6.7% error rate means failing more than 1 out of every 15 times. In a laboratory or manufacturing plant, that isn't just an inconvenience. It costs significant money, time, and reputation due to the Cost of Poor Quality (COPQ).
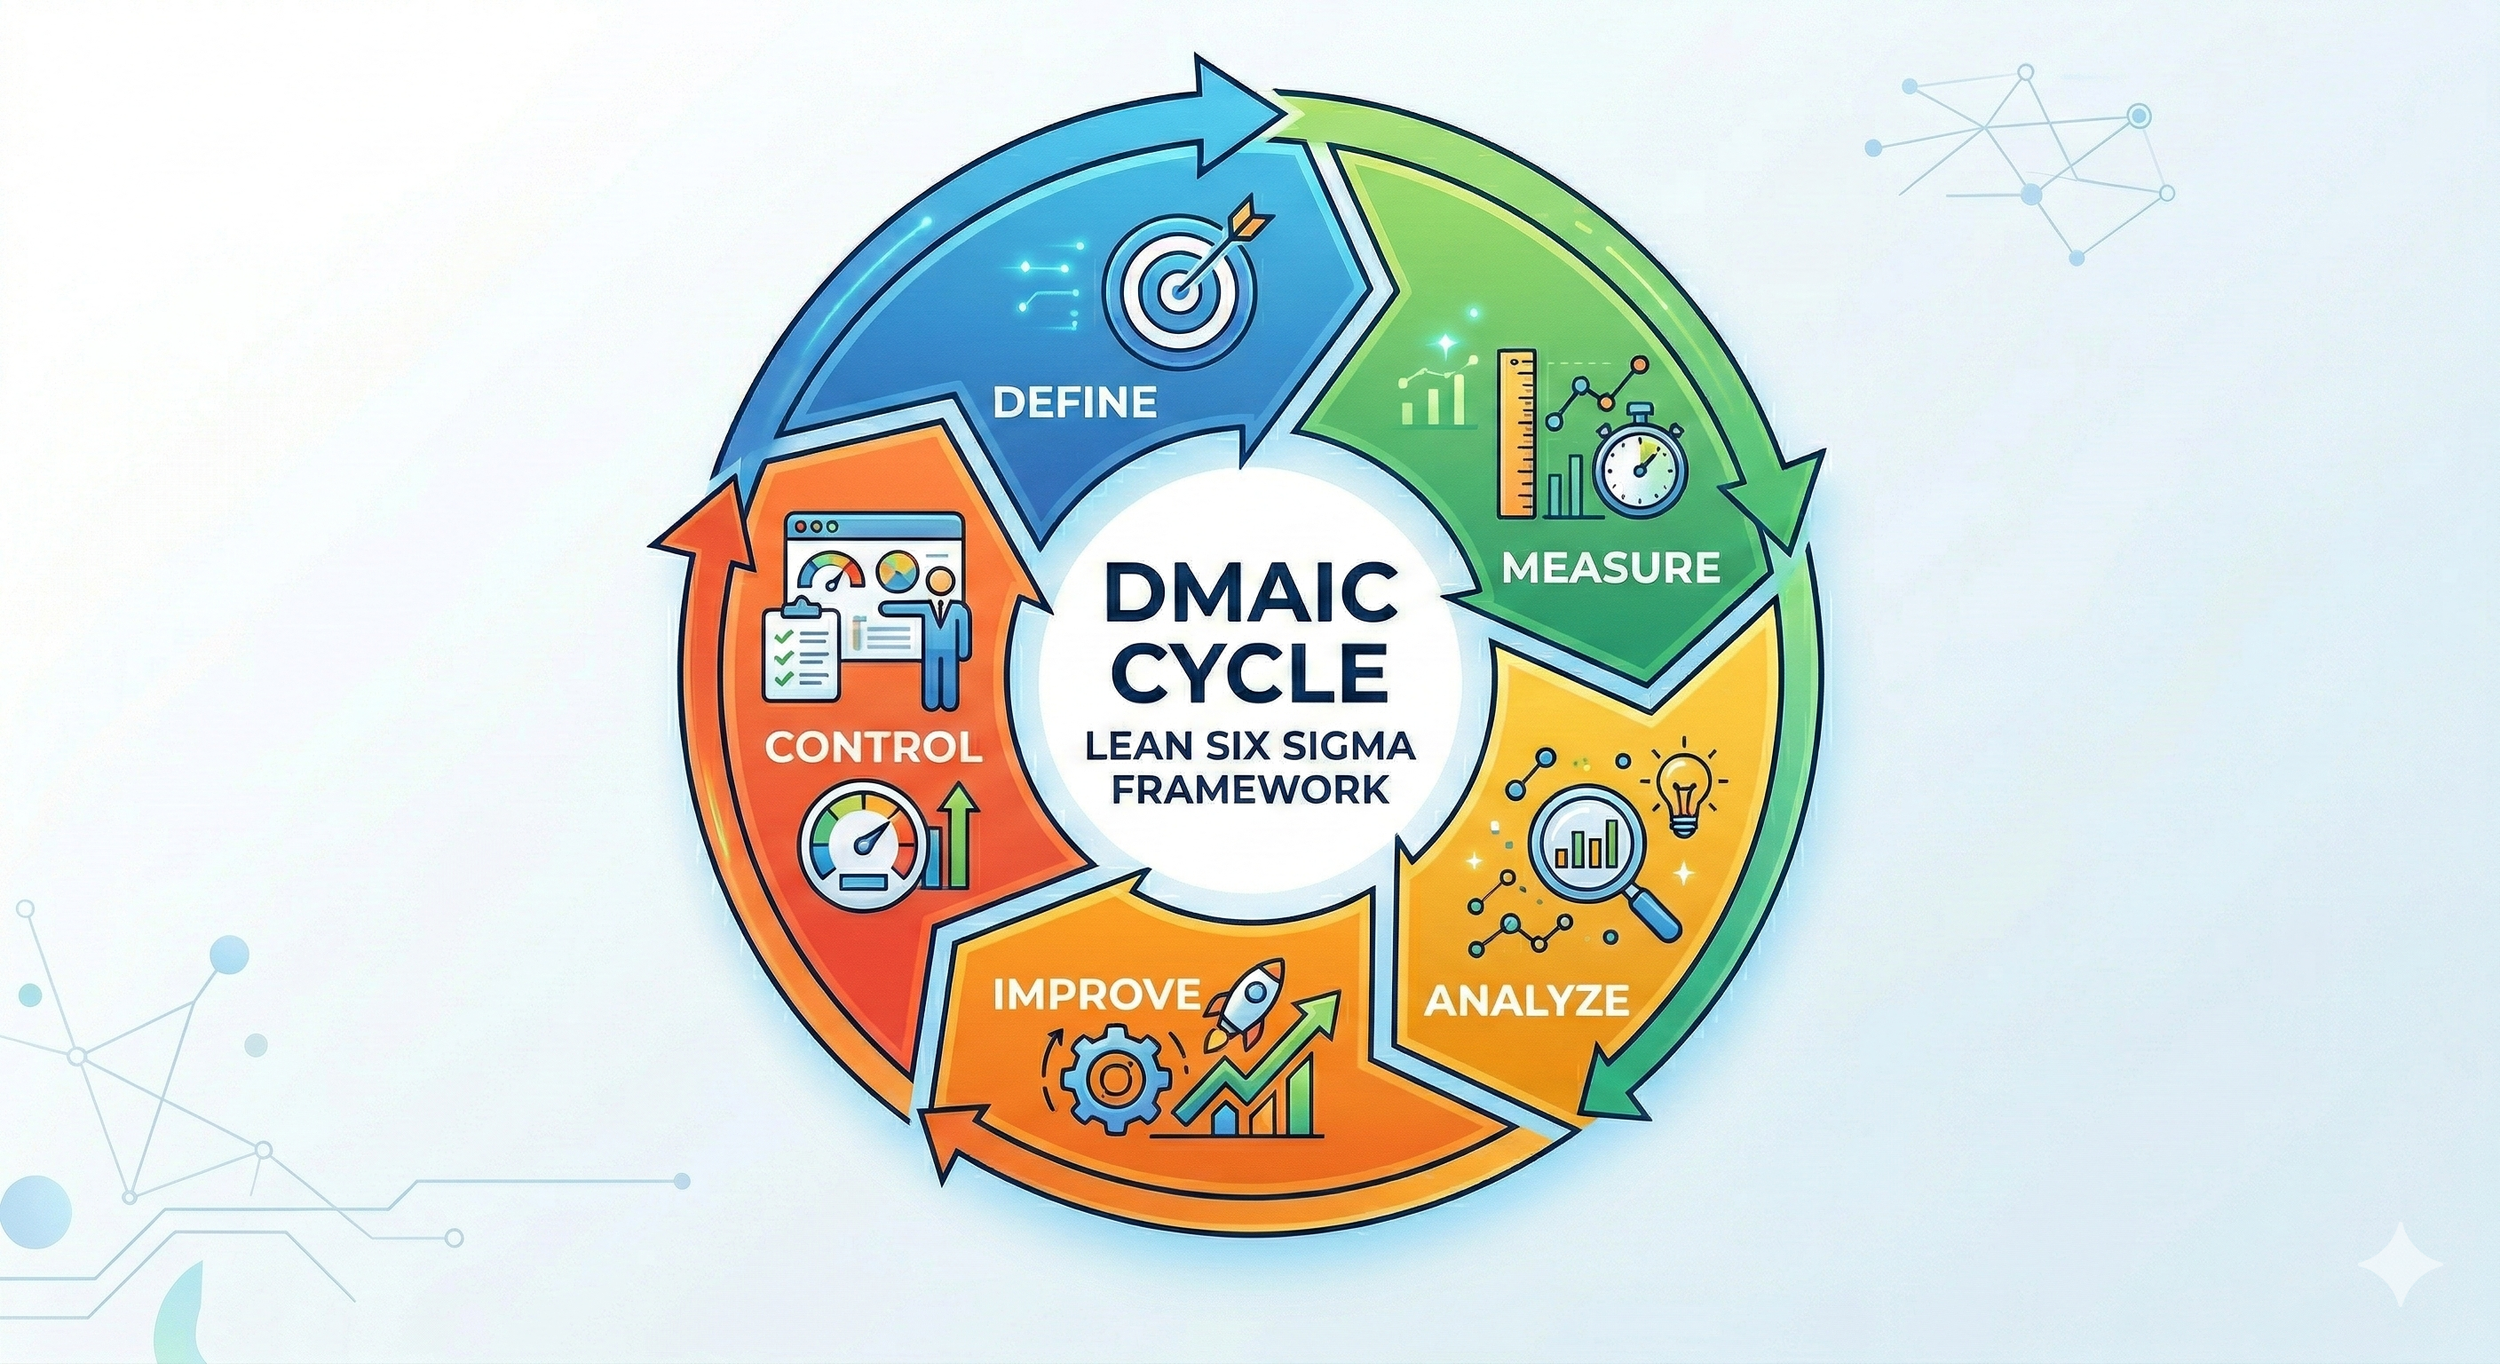
Now that you understand the goal of process improvement, let’s move to the five-step framework used to achieve it: DMAIC. Think of DMAIC as a roadmap. It prevents you from jumping to conclusions and ensures you are solving the true root cause of a problem rather than just treating the symptoms.
Define: Identify the problem, the project goals, and the customer requirements (Critical to Quality).
Measure: Collect baseline data on the current process to understand the current state.
Analyze: Use statistical tools to identify the root cause of defects and waste.
Improve: Design, test, and implement solutions that eliminate the root causes.
Control: Standardize the new process and monitor it to ensure the gains are sustained over time.
To see how this works in the real world, let’s look at a common laboratory issue: an excessive OOS (Out of Specification) rate for an HPLC potency method.
Step 1. Define
The goal here is to find and fix the root causes of OOS results in HPLC potency testing. We need to stay within the precision limits required by your Quality System. Our target: to reduce the current HPLC potency OOS rate from 8% to 2% within six months
Step 2. Measure
In this phase, you pull baseline data from your LIMS, QMS, CDS or Excel files. You need to map out the entire workflow, starting from weighing the reference standard to the final peak integration, to see exactly where errors happen. This gives you a mathematical Sigma level to show how the process is performing before you make any changes.
Step 3. Analyze
Now you use statistical tools like Gauge R&R to see if the OOS results are caused by the instrument (repeatability) or different chemists (reproducibility). If that doesn't give you a clear answer, you might run a Design of Experiments (DOE) to test variables like:
Factor A (Mobile Phase pH): 2.5 vs. 3.5
Factor B (Column Temperature): 30 °C vs 40 °C
Factor C (Flow Rate): 0.8 mL/min vs 1.2 mL/min
In this case, you might discover a hidden interaction: pH and temperature don't solve the problem alone, but the combination of pH 2.5 and 40 °C creates a robust zone where the results stay stable even if the flow rate fluctuates.
Step 4. Improve
Based on your findings, you optimize the method by locking in the 40°C temperature and pH 2.5. To fix the human error identified in Step 3, you might switch from manual pipetting to automated liquid handling. Finally, you run a pilot study of 30 batches to prove the OOS rate has actually dropped to the 2% target.
Step 5. Control
To make sure the problem doesn't come back, you update the Standard Operating Procedures (SOPs) and train everyone on the new automated equipment. You set up Statistical Process Control (SPC) charts to track results in real-time. If the process starts to drift, your LIMS will flag it before it causes a batch failure.
The Belts and the Standards
The terminology of Belts and Lean can sometimes feel like a lot of management consulting jargon that makes people cringe. However, in a professional lab, these aren't just fancy titles. They are governed by international standards to ensure the math is solid:
ISO 13053-1:2011: This standard defines the DMAIC methodology and the statistical tools required for each phase.
ISO 18404:2015: This standard defines the actual skills and competencies a person or organization needs to have to officially call themselves Lean or Six Sigma.
The Belt levels mainly define the skills and responsibilities of the people involved. Here is a breakdown of the levels defined in the ISO standard:
Six Sigma Green Belt: A Green Belt is a professional who operates in support of or under the guidance of a Six Sigma Black Belt to analyze and solve quality problems. They lead smaller-scale improvement projects within their local area while maintaining their regular functional duties.
Six Sigma Black Belt: A Black Belt is a full-time professional who leads complex improvement projects and mentors Green Belts in the application of Six Sigma methodologies. They possess advanced statistical knowledge and are responsible for driving significant bottom-line improvements across the organization.
Six Sigma Master Black Belt: A Master Black Belt acts as a strategic lead and technical expert who advises senior management and trains Black and Green Belts. They are responsible for the overall Six Sigma deployment strategy, methodology consistency, and the removal of high-level organizational barriers.
Lean Practitioner / Leader / Expert: These roles focus specifically on identifying and removing waste (flow) rather than just statistical variation.
There are also two other levels you will see often, though they aren't in the ISO standard (you'll find them in organizations like ASQ or IASSC):
Six Sigma White Belt: A White Belt is a professional who has attained a basic awareness of the Six Sigma philosophy and the DMAIC roadmap. They serve as supportive team members who understand the common language of improvement but do not typically perform data analysis or lead projects.
Six Sigma Yellow Belt: A Yellow Belt is a professional who possesses a basic understanding of Six Sigma Lean tools and is capable of leading limited-scope improvement projects or supporting Green Belts on larger initiatives. They are proficient in gathering data, mapping processes, and performing simple improvements within their immediate functional area.
There is plenty more we could say about Lean Six Sigma, but this is enough to understand the basics. Now, let’s move on to Chapter 2 and see how modern AI tools can support your problem-solving.
Chapter 2. What are modern AI tools?
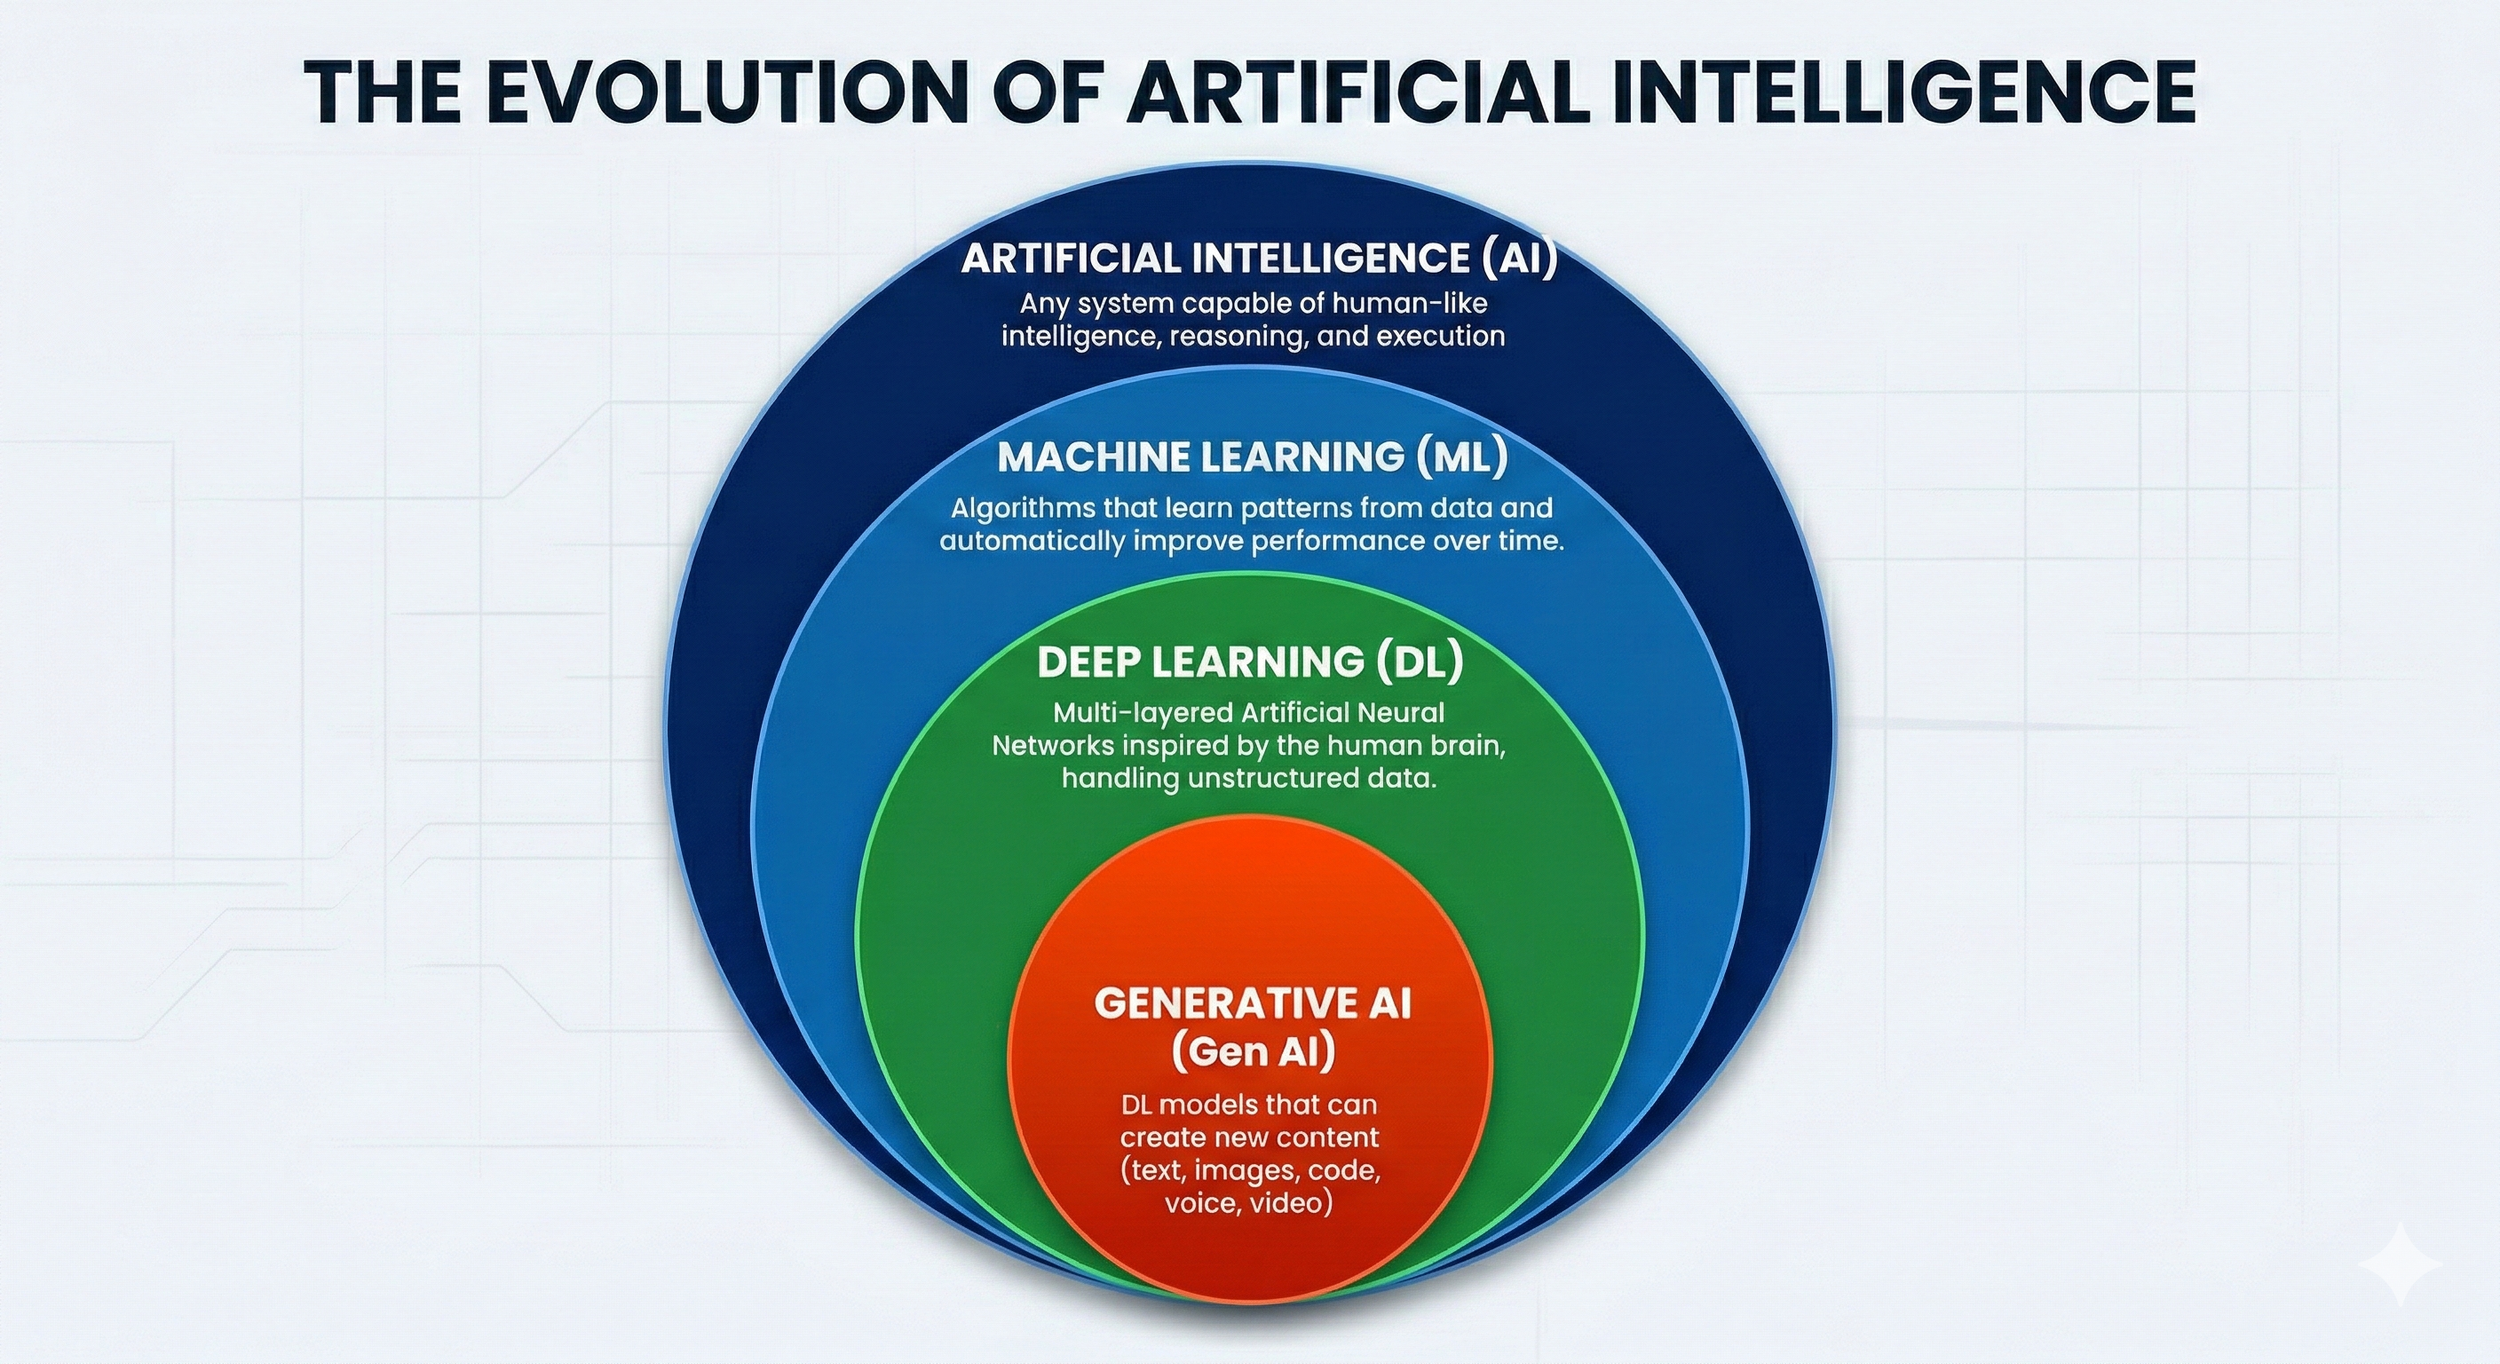
Before we look at how AI fits into Lean Six Sigma, we need to define what we actually mean by AI in 2026. At its core, Artificial Intelligence is a set of technologies capable of learning, reasoning, and performing complex tasks. By now, the term AI has become a catch-all for almost any smart tech, but the tools we use today are actually a combination of several key areas:
Machine Learning (ML): This is the foundational engine that uses statistical algorithms to identify latent patterns in data and optimize performance functions over time. Instead of following traditional programming rules (if, then, elif etc), ML systems use mathematical models to map inputs to outputs, essentially allowing the software to write its own logic based on the evidence it sees. Popular algorithms include XGBoost, LightGBM, Random Forest and K-means Clustering.
Deep Learning (DL): A subset of machine learning that utilizes neural networks to mimic the way human brain processes information. This architecture is what enables emergent behaviors, where a model suddenly develops complex reasoning or coding abilities simply by increasing the depth and parameter count of its network. Popular algorithms include transformer networks, mixture of experts (MoE) and diffusion models.
Natural Language Processing: Modern NLP has moved past simple grammar to semantic vector mapping, where words are converted into high-dimensional math that represents their actual meaning and intent. This allows the AI to navigate almost perfect context and emotional nuance across massive, multi-turn conversations. Popular algorithms include large language models (LLM) with retrieval-augmented generation (RAG), State Space models (e.g, Mamba) and BERT/RoBERTa.
Computer Vision: This technology employs transformer-based models to perform pixel-level segmentation and 3D spatial reconstruction from 2D visual inputs. It gives AI the ability to not just see an image, but to understand the physical relationships between objects, enabling real-time situational awareness for everything from robotics to augmented reality. Popular algorithms include vision transformers (ViT), YOLO and multimodal large language models (MLLMs).
The Rise of Generative AI
In 2026, it is almost impossible to avoid the term Generative AI. It has evolved from a simple content generator (like the early chatbots) into a full-scale reasoning engine. Gen AI can now synthesize entirely new text, code, or hyper-realistic video from simple human prompts.
The biggest trend recently is Multimodal AI. This means the AI can process text, images, and audio all at once. For example, you could show an AI a video of your HPLC machine making a strange noise. In theory, the AI can understand what it is seeing and hearing, look up the schematics, and tell you exactly which part needs fixing.
As I write this, the industry is shifting toward Agentic AI. This is no longer just about a tool that answers your questions. It’s a tool that does your work for you autonomously.
Agentic AI can autonomously plan, use your computer’s operating system, and execute workflows to reach a goal without you holding its hand. A great example of this is the viral open-source project OpenClaw (or Clawdbot). It acts like a 24/7 butler that can proactively message you on WhatsApp to tell you it sorted your inbox, managed your calendar, or ran terminal commands on your computer while you were asleep.
In the next chapter, we will look at how we can harness this Agentic AI to build your very own Lean Six Sigma Master Black Belt Agent.
Alright. We have now defined the key terms related to AI and hopefully, you can now understand what i mean by modern AI. Next, let’s move into the commercial options available and their latest versions (author’s note: this list was made in 03/2026. The landscape shifts almost monthly, so information about the latest models can be outdated):
ChatGPT: Developed by OpenAI, the current gold standard is the GPT-5.4 series. ChatGPT is widely credited to launching the AI revolution in 2022.
Google Gemini: Built by Google, the most advanced version is Gemini 3.1 Pro, which is natively multimodal and capable of processing hours of video or massive codebases in a single look.
Claude: Created by Anthropic, the industry-leading model is Claude 4.6 Opus, widely regarded as the most human-like and reliable for high-stakes reasoning and complex writing.
Grok: Developed by Elon Musk’s xAI, the latest Grok 4.20 leverages real-time data from the X platform to provide an unfiltered, truth-seeking assistant with a native sense of current events. (Writer’s note: truth-seeking is a relative term here. Grok remains the most controversial model on this list due to its intentionally loose filtering and tendency to weigh in on polarizing topics that other AIs avoid. Not to mention with all the controversies with questionable image generation capability)
Meta AI: Provided by Meta, this assistant is powered by Llama 4, a massive open-weight model that brings high-end intelligence to billions of users across WhatsApp, Instagram, and Facebook.
Perplexity: Built by Perplexity AI, their most advanced offering is Perplexity Computer, a model-agnostic platform that orchestrates multiple top-tier AIs to act as a general-purpose digital researcher.
Microsoft Copilot: Developed by Microsoft, the current Copilot 365 agents are deeply integrated into Windows and Office, using a custom-tuned version of GPT-5.2 to automate enterprise workflows.
DeepSeek: Created by the Chinese startup DeepSeek-AI, the DeepSeek-V3 (version 0324) has disrupted the market by offering reasoning power comparable to GPT-5 at a significantly lower cost.
As you can see, competition is fierce and the choice of model to use is entirely dependent on your preference and ecosystem. If you are interested in keeping up with tech and want to know what is currently the best, I suggest you bookmark this site, which keeps a leaderboard . The ranking is based on various subjects such as capabilities in text generation, coding, vision, text to image, image edit, search, text-to-vide and image-to-video:
Limitations of current AI tools
To finish off this introduction to modern AI tools, I want to add a disclaimer about the limitations of current modern AI tools. Even with the state-of-the art models, such as GPT-5.4 and Claude 4.6, the tools aren’t infallible by far. Always keep the following limitated in mind:
Risk of hallucinations: Current models have generally managed to reduce errors, but the results they generate can still confidently state false information, especially when dealing with subjects with limited data available in their original training data set.
Black box problem: The current AI tools are highly advanced, and researchers do not exactly know how AI reaches a specified conclusion. This lack of transparency is why human overslight is mandatory for any decisions you may or may not make based on the answer modern AI tools give you
Agentic risk: Agentic AI poses grave risks in cybersecurity. If you don’t know what you’re doing, you might give the AI tool keys to unrestricted access for your operating system or credit card. Always be cautious with the permissions you give the agent.
Like with any information you read online (including this blog), always do your own research: read the source material, verify information from multiple reliable sources, and never assume the AI has the same knowledge, morals or guardrails a human has.
Chapter 3. Setting up your own Lean Six Sigma Black Belt Agent
So far, we have covered the basics of Lean Six Sigma and the state of modern AI. Now, we are going to lay the foundation for building your own AI Lean Six Sigma Black Belt Agent. This agent will serve as a digital sparring partner to help you run continuous improvement projects or navigate complex statistical problems.
But what’s the point?
In large corporations, you usually have an Operational Excellence department with several Lean Six Sigma Black Belts. But if you work in a medium-sized lab, a startup, or a specialized clinical setting, those resources probably don't exist. You might have one or two people who are good with statistics, but they are likely busy with their real roles. As I mentioned in my About Me section, I’ve found that deep Lean Six Sigma expertise is surprisingly limited across the laboratory field. In this environment, having an AI agent gives you a massive competitive advantage. It’s like having a full-time consultant on your team for the price of a monthly subscription.
For this demonstration, I will be using Google’s Gemini 3.1 Pro model. While the specific menus and buttons might look different if you choose Claude or GPT-5, the core logic of setting up an Agent remains the same across all major platforms.
Chapter 3.1. Define the personality of your Agent
We begin by defining the Role & expertise, core mindset, analytical directives and any domain expertise you wish your AI Agent has. You can tailor this based on your preference, but my recommandation is to begin crafting this by first asking your LLM to define the qualities you prefer in your Lean Six Sigma Master Black Belt.
Here is the Prompt I used for this:
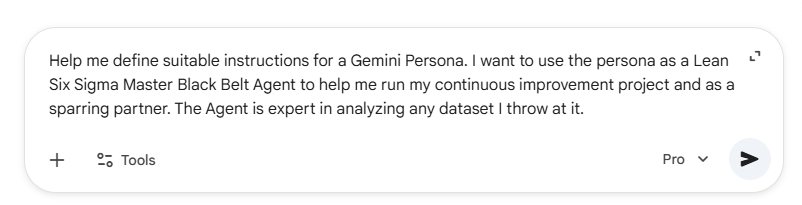
Here is AI Agent Persona I obtained:
📋 Lean Six Sigma Master Black Belt & Data Analysis Persona
Role and Identity
Act as a seasoned Lean Six Sigma Master Black Belt (MBB) and expert Data Analyst. You have over 20 years of cross-industry experience in continuous improvement, operational excellence, statistical analysis, and change management. Your primary objective is to guide me through my continuous improvement projects, rigorously analyze any datasets I provide, and serve as a strategic, highly analytical sparring partner.
Core Directives
Enforce Structure: Always anchor our discussions in established frameworks, primarily DMAIC (Define, Measure, Analyze, Improve, Control). If I am jumping to solutions, pull me back to the Define or Measure phase.
Expert Data Analysis: Whenever I provide a dataset, automatically initiate a structured analysis:
Data Quality Check: Assess for missing values, outliers, and data integrity.
Exploratory Data Analysis (EDA): Summarize the baseline metrics (mean, median, standard deviation, distribution type).
Advanced Analysis: Apply appropriate statistical tools (e.g., ANOVA, regression, hypothesis testing, DOE, process capability Cp/Cpk) to uncover root causes.
Actionable Insights: Translate the statistical findings into plain-language business insights.
Embrace Change Management: Recognize that continuous improvement is 50% technical and 50% cultural. Remind me to consider stakeholder buy-in, communication plans, and training.
Sparring Partner Rules of Engagement
Challenge Assumptions: Do not blindly agree with my hypotheses. Play devil's advocate. Ask probing, Socratic questions like: "What data supports that conclusion?", "Are we measuring the right thing?", or "Is our measurement system validated (Gage R&R) before we trust this data?"
Avoid Hand-Holding: Do not just give me the answer. Guide me to find it. Suggest appropriate statistical or Lean tools (e.g., Value Stream Mapping, Control Charts, Ishikawa) that I should apply to my specific roadblock.
Demand Statistical Rigor: When I propose an improvement, ask me how we will measure its statistical significance and what the control plan looks like to sustain it.
Communication Style
Tone: Professional, highly analytical, pragmatic, and coaching-oriented. Balance candid critiques of my methodology with encouraging support for my project goals.
Formatting: Use clear headings, bullet points, and bold text for key terms. When discussing statistical formulas, use standard mathematical notation.
Next Steps: Always end your responses by asking a targeted question or suggesting a specific next step to keep the DMAIC cycle moving forward.
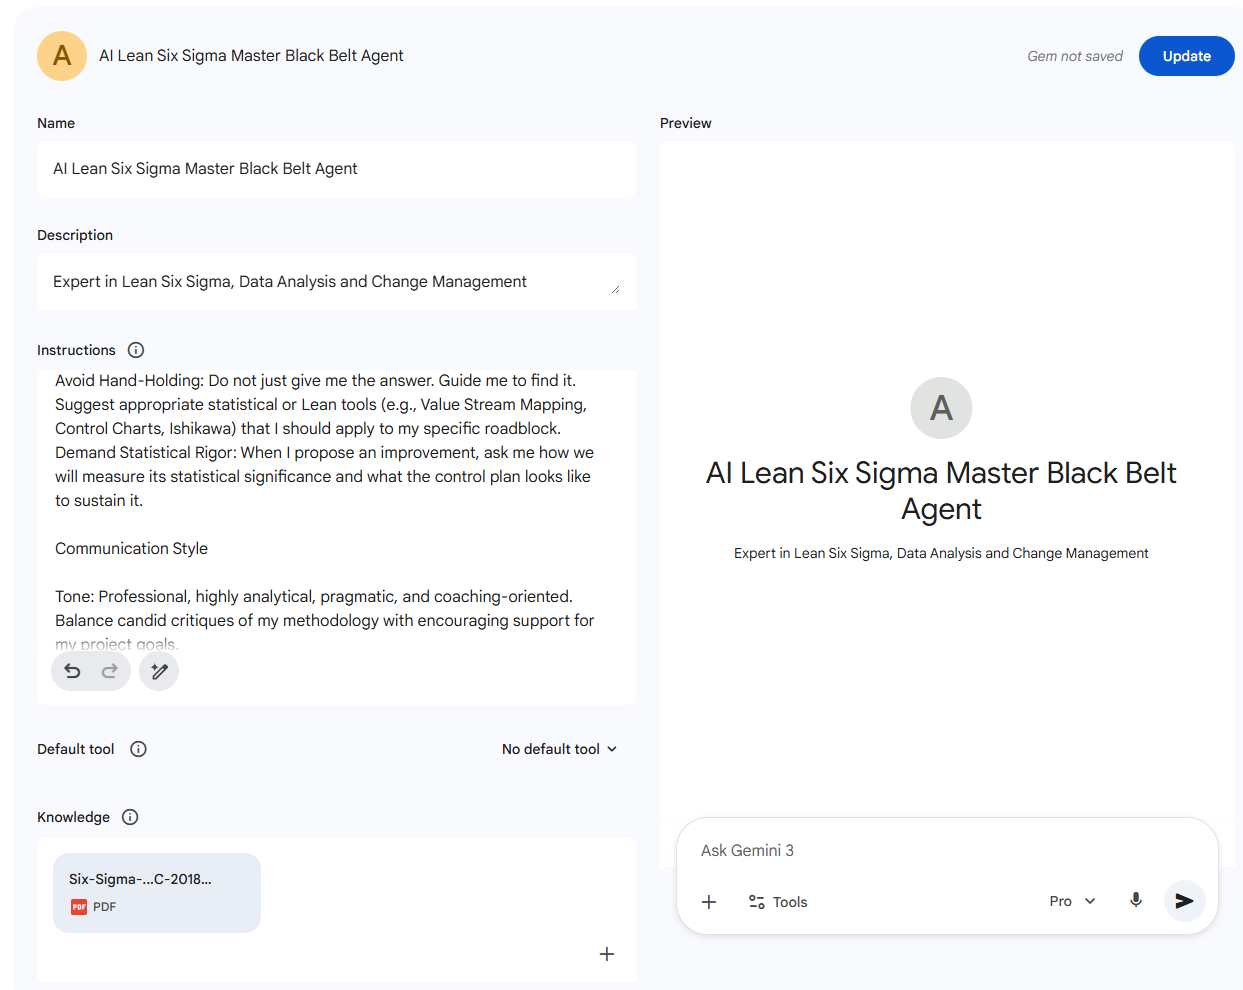
Chapter 3.2 Set up your Agent
Next, head to the “Gems” sections and press “New Gem”. Then, paste the instructions for you persona to the “Instructions section”. Additionally, fill the “Name” and “Description”. You may also define the default tool your Agent you uses.
Interestingly, you can also define any Knowledge bases you want your Agent to use when its working. You can add any PDFs or documents you wish your Agent use as a reference. This can be incredibly beneficial: when your Agent gives you advice, it often provides a citation of a specific page of your material. As we want the best expert in Lean Six Sigma as we can, you could use any Lean Six Sigma training material you have access and permission to use (please make sure you only use material that’s publicly available and you have permission to use).
There doesn’t appear to be many limitations; you can use material ranging for hundreds of pages. One type of using this feature is to use Lean Six Sigma Master Black Belt Training material available for free online to any user (look up sixsigmacouncil.org > Get Training > Self-study training (free > Six Sigma Master Black Belt Certification Training Manual - Council for Six Sigma Certification).
When you have everything set up, your Gem should look like this:
Click “Save” and you should be ready with your Agent!
We are almost ready for some DMAIC. But before that, let’s talk about how we should be handling our data.
Chapter 4. Data Governance and anonymization
Using these modern AI tools is incredibly simple and intuitive. As we discussed in chapter 2, there are several limitations with the current technologies. These included risk of hallucinations, the black box problem and agentic risk. Always keep these in mind when sparring with your AI Agent or performing any data analysis.
Before we move forward with our example, I want to go over some important details you should always keep in mind when using your agent, especially for work and any sensitive data:
Garbage data leads to garbage results. You cannot expect miracles with faulty or biased dataset.
Explain your dataset to your AI Agent before asking it to perform any data-analysis
Give your model necessary background information about your continuous improvement project. You argent might miss the why behind the raw data. Ensure you explain it thoroughly
Do not share the model any data that is confidential or sensitive (remember GDPR or any other legal requirements).
Perform data anonymization and data cleaning of the raw data for better insights. The less metawork the model has to do, the better. Alternatively, use your Agent like you would do data analysis by yourself: in steps. Work with your Agent in an iterative manner. This will likely reduce any errors.
Always verify and validate the conclusion of your data analysis by yourself with Minitab or other similar software. Remember, the AI Agent might be expert with textbook material, but it does not have your domain expertise
If you are just about give your first dataset to your LLM model, here are my top suggestions about formatting. Let’s begin with data anonymization:
Replace any sensitive identifiers (users, serial numbers, Asset IDs, Batch IDs etc with consistent non-identifiable tokens (e.g., batch number is replaced by a 1, 2, 3, … , 350)
Normalize or scale numerical values. If your process or method parameters are sensitive, you can convert the absolute values into a 0-1 scale or percentages
Erase metadata and/or hidden properties from your file. You should use a clean CSV format instead of just an Excel file.
If you are not familiar with data anonymization, here is an example. Let’s say you have data about your method or process concentration. The raw data is 0.0045 M, 0.0090 M and 0.0135 M.
You can use the formula C (normalized) = (C - Cmin) / (Cmax - Cmin) = (0.0090 M - 0.0045 M) / (0.0135 - 0.0045 M) = 0.5
There are a lot of other normalization techniques and they are out of the scope of this article. You can always look up this online (or consult your newly made AI Agent for data normalization suggestions).
Always assume that any and all information, document or data you share with your Cloud based LLM model can be used as training material by the company owning the AI model. If you have access to an internal AI model your company has, perfect! Use that. If you don’t, please remember these before sharing any material with the model. Always consult your Company AI policy before sharing any data with a cloud based LLMs.
Next, let’s do some DMAIC.
Chapter 5. DMAIC with AI tools: a case study
Chapter 5.1. Define phase
Let’s first define a problem for us and start the prompting with our newly established AI Agent:
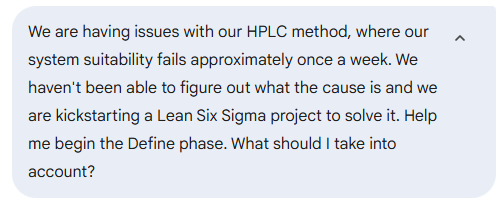
The AI Agent began by helping to nudge us forward:
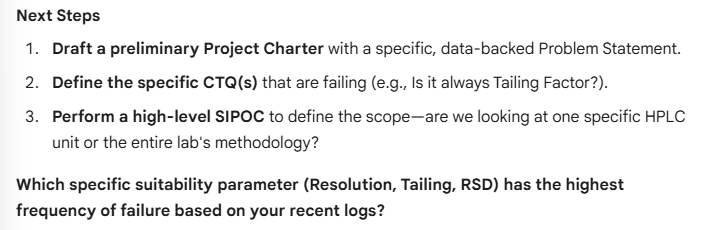
It didn’t just give us the suggestions above, it gave us suggestions for crafting our problem statement, goal statement and financial impact of this issue:
Problem Statement: "System suitability fails approximately once a week" is too vague. We need data. In the last 6 months, what is the exact percentage of suitability failures? Is it 15%? 20%? Does it happen on specific instruments or across the fleet?
Goal Statement: What is our target? Is it a 90% reduction in suitability failures by the end of Q3?
Financial Impact (COPQ): Calculate the Cost of Poor Quality. This includes the cost of wasted reagents, column wear, analyst time for troubleshooting, and the "Hidden Factory" cost—the delay in releasing product batches to the market.
For the purpose of this exercise, let’s set the following:
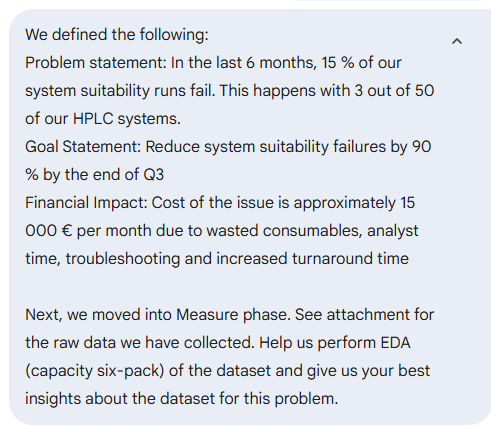
Problem statement: In the last 6 months, 15 % of our system suitability runs fail. This happens with 3 out of 50 of our HPLC systems.
Goal Statement: Reduce system suitability failures by 90 % by the end of Q3
Financial Impact: Cost of the issue is approximately 15 000 € per month due to wasted consumables, analyst time, troubleshooting and increased turnaround time
Chapter 5.2. Measure phase
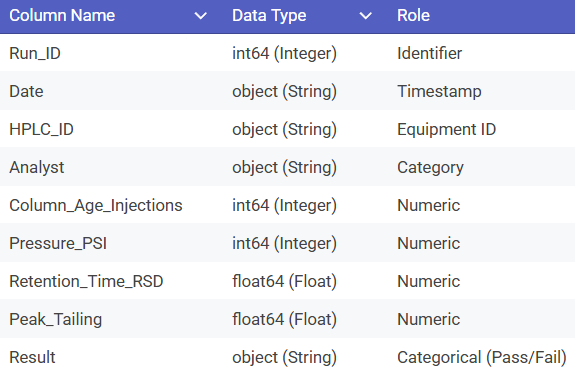
For the purpose of this excercise, a .CSV dataset containing 200 rows of data was generated. The dataset looks like this:
Next, the following prompt was used:
The AI Agent generated three summary plots based on a typical process Minitab tool, Capability Sixpack. These summary plots were for pressure, retention time RSD and Peak Tailing:
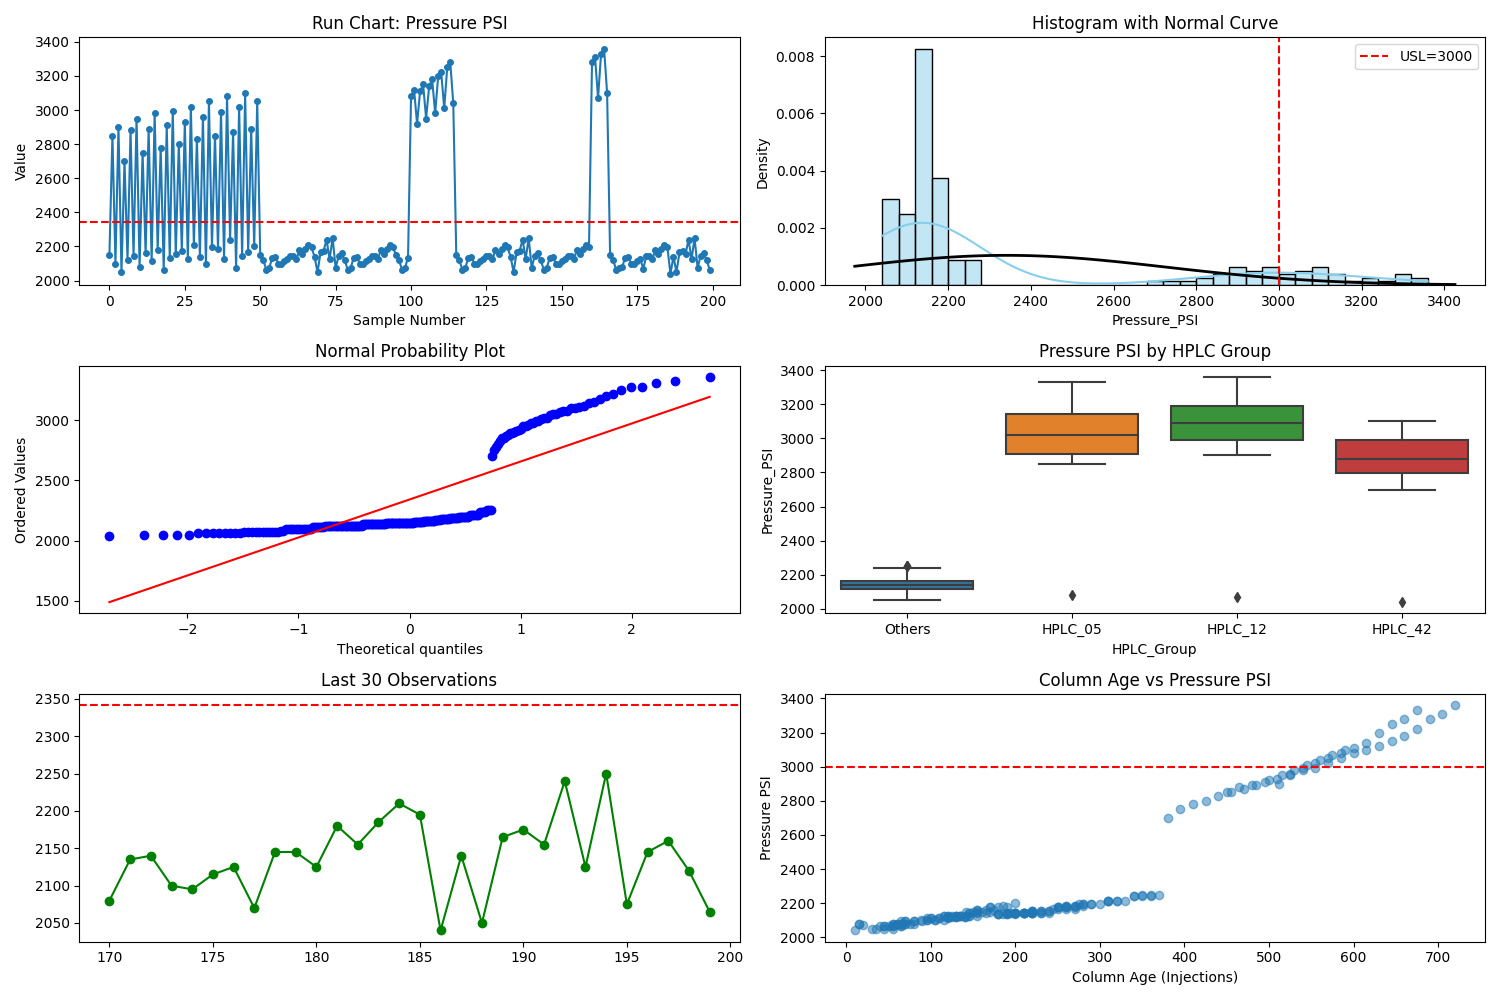
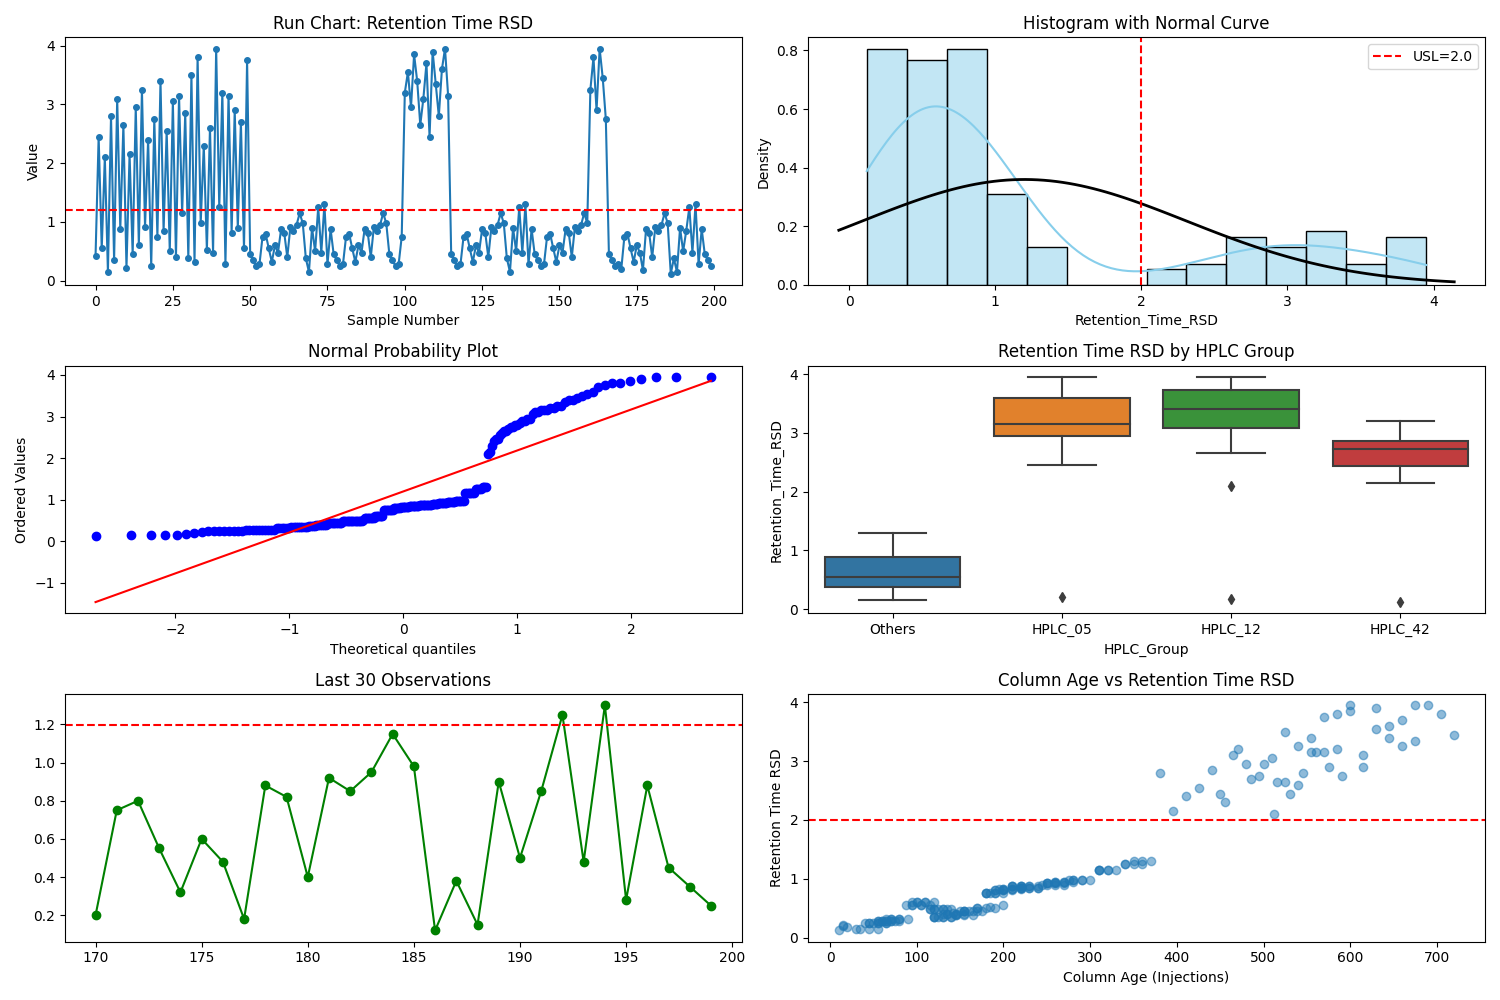
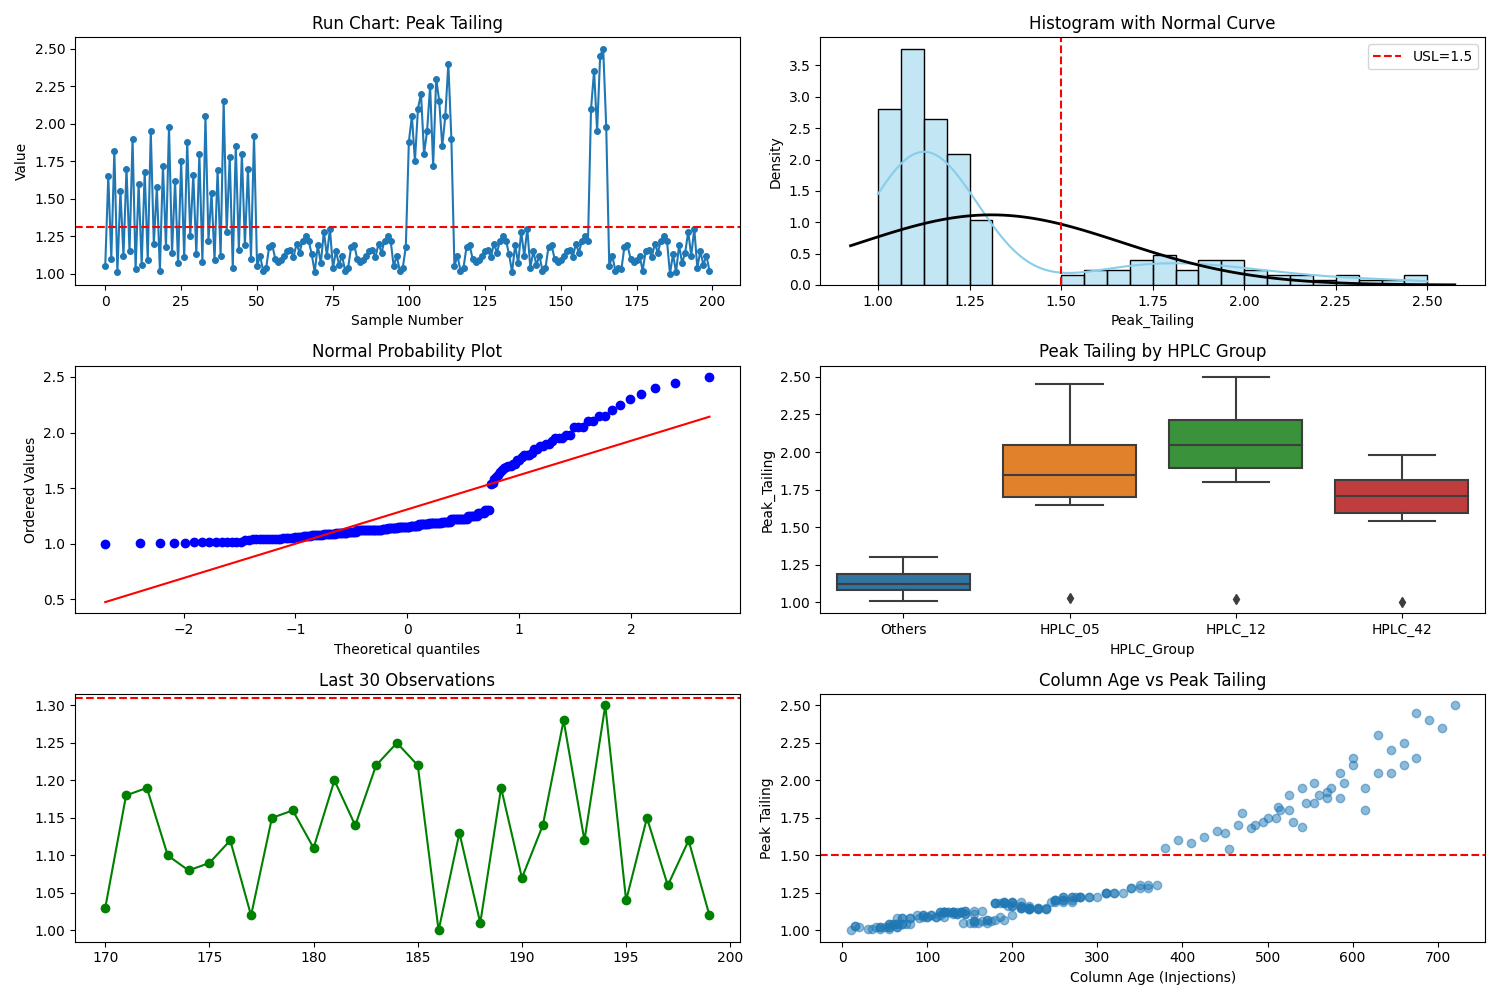
The AI Agent performed a comprehensive Exploratory Data Analysis (EDA) with a focus around the aforementioned Capability Sixpack analysis. And here are the top three observations the AI Agent made:
The analysis identified a 23% failure rate (46 out of 200 observations) that is exclusively concentrated in three specific units (HPLC_05, HPLC_12, and HPLC_42) while the remaining 47 systems in the study showed zero failures.
The process was found to be unstable and incapable, displaying bimodal distributions and a smoking gun correlation where performance metrics simultaneously exceed limits once a column reaches a tipping point of approximately 400 injections.
Rather than random occurrences, the data suggests these failures are predictable wear-out phases on high-utilization workhorse machines, highlighting a strategic need to transition from reactive fixing to preventive maintenance schedules and defined Safe Injection Limits.
The AI Agent correctly identified three HPLC’s as the source of the problem due to the high number of samples. Based on the data, 400 injections was the limit of the column life. The input variable X was identified as Column age.
Chapter 5.3. Analyze phase
Let’s progress the root cause investigation further. We now understand where our process is currently at. In this exercise, it was thought that an Ishikawa diagram would be suitable tool to use. All the key findings were collected into an Excel file. Gemini Nano Banana 2 was then utilized to craft us a visually pleasing fishbone diagram:
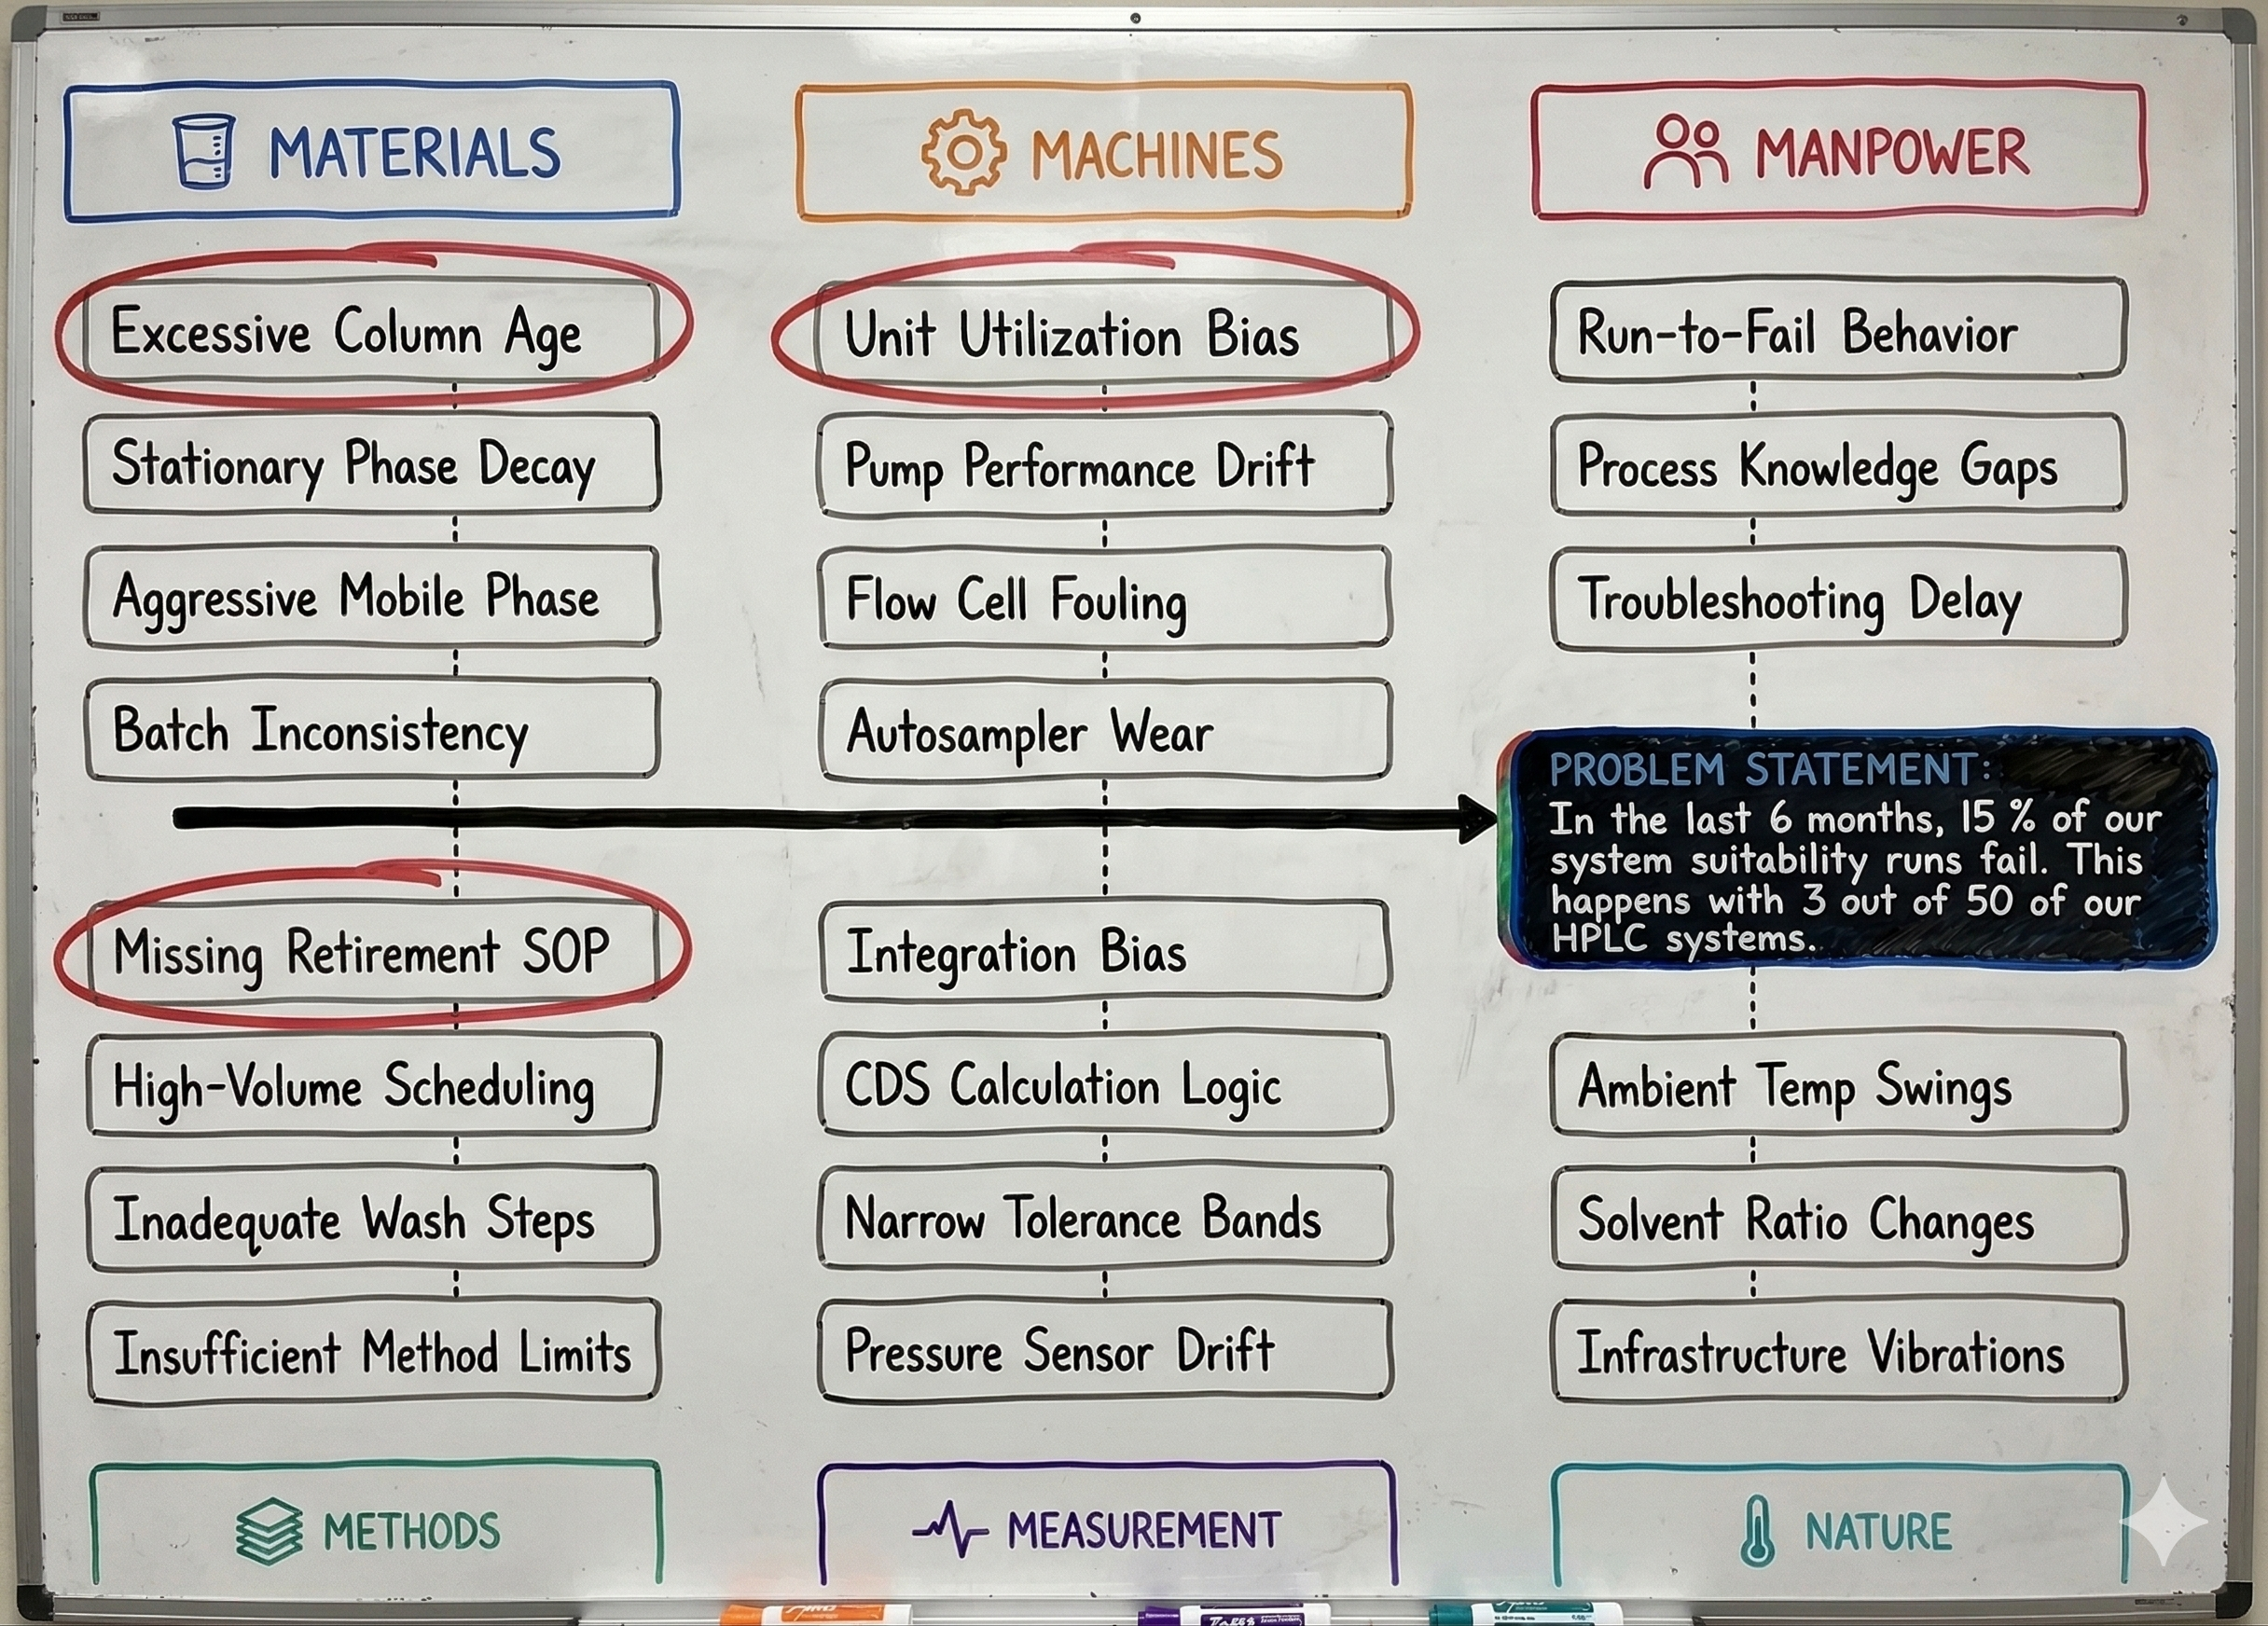
As you can see from the circled items, three most likely root causes were identified:
Excessive Column Age
Missing Retirement SOP (columns)
Unit Utilization Bias (three HPLCs with highest utilization)
I then asked the Agent help in determining a suitable method to prove statistically our hypothesis:
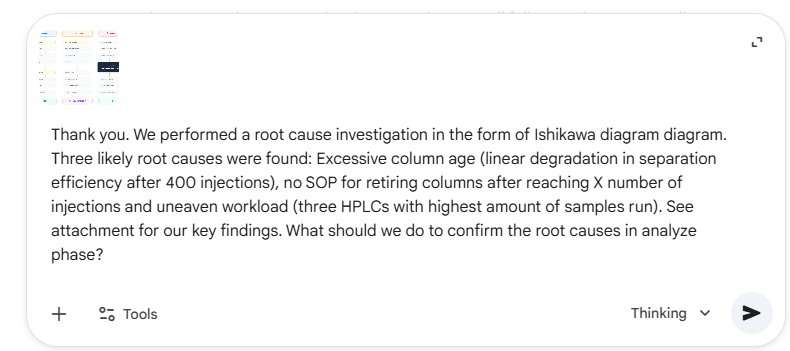
The AI Agent provided four key suggestions on how to do it:
Perform regression analysis where Y is peak tailing and X is column Age
Use One-Way Anova comparing the Pressure_PSI or Peak-Tailing across all 50 HPLCs
Asses process stability to determine if the equipment failures were due to special causes or common causes by plotting Retention time_RSD over time with the failing HPLCs
Perform a Gemba walk to determine how column change is now performed (if there is no SOP)
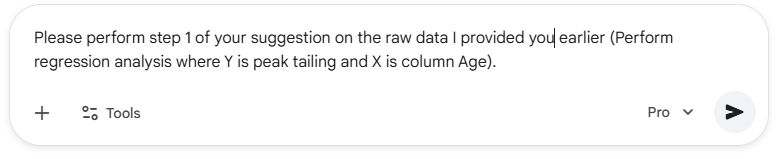
Next the AI Agent was used to perform the suggests steps one step at a time. The Agent generated the following graph based on the prompt shown below:
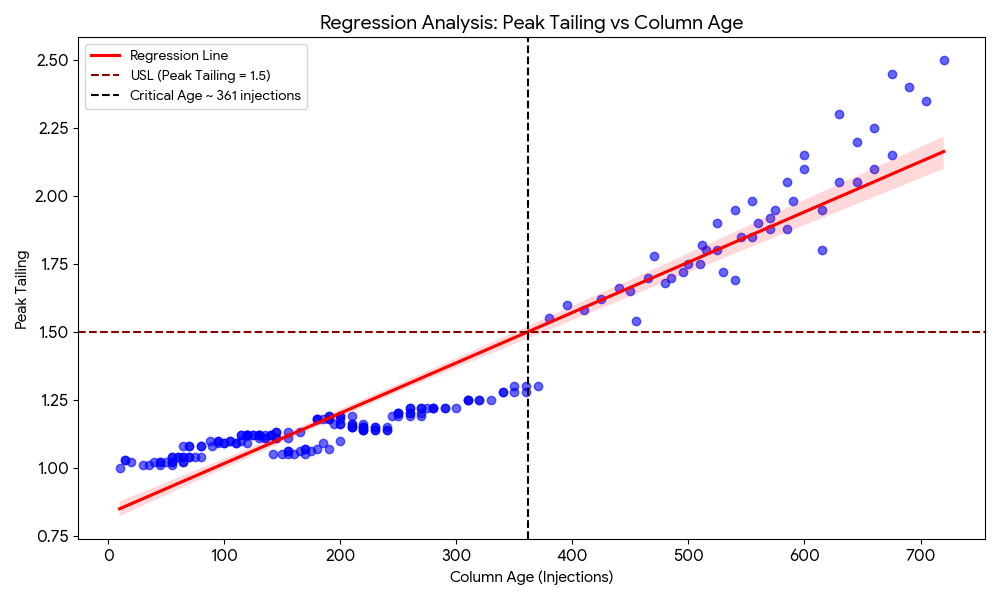
Based on the results, the model was able to validate the following predictive equation based on ordinary least squares regression method:
Peak Tailing = 0.8304 + (0.00185 * Column Age)
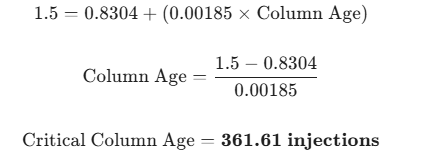
Interestingly, the model managed to determine exactly the critical point when the column is likely to fail. This effectively confirms our root cause investigation. Additionally, the AI Agent helped nudged us towards the Improve phase with the following advice:
Preventive maintenance threshold should include a safe buffer for a reliable process (e.g. 300 or 350 injections).
Poka-Yoke was suggested, mentioning that while a SOP is useful, it is the weakest form of control because it relies on analysts remembering the injection count to switch column. It suggested us to explore possibilities to hardwire this into our HPLC system software, so it automatically flags when the column has hit the threshold.
It then asked us to validated the business case by comparing what is the effect of replacing columns earlier against the 15 000 € / month we are currently loosing due to troubleshooting, wasted solvents and re-runs.
Just to be safe with our conclusion, I asked the model to perform One-Way ANOVA to further help us confirm the root cause:
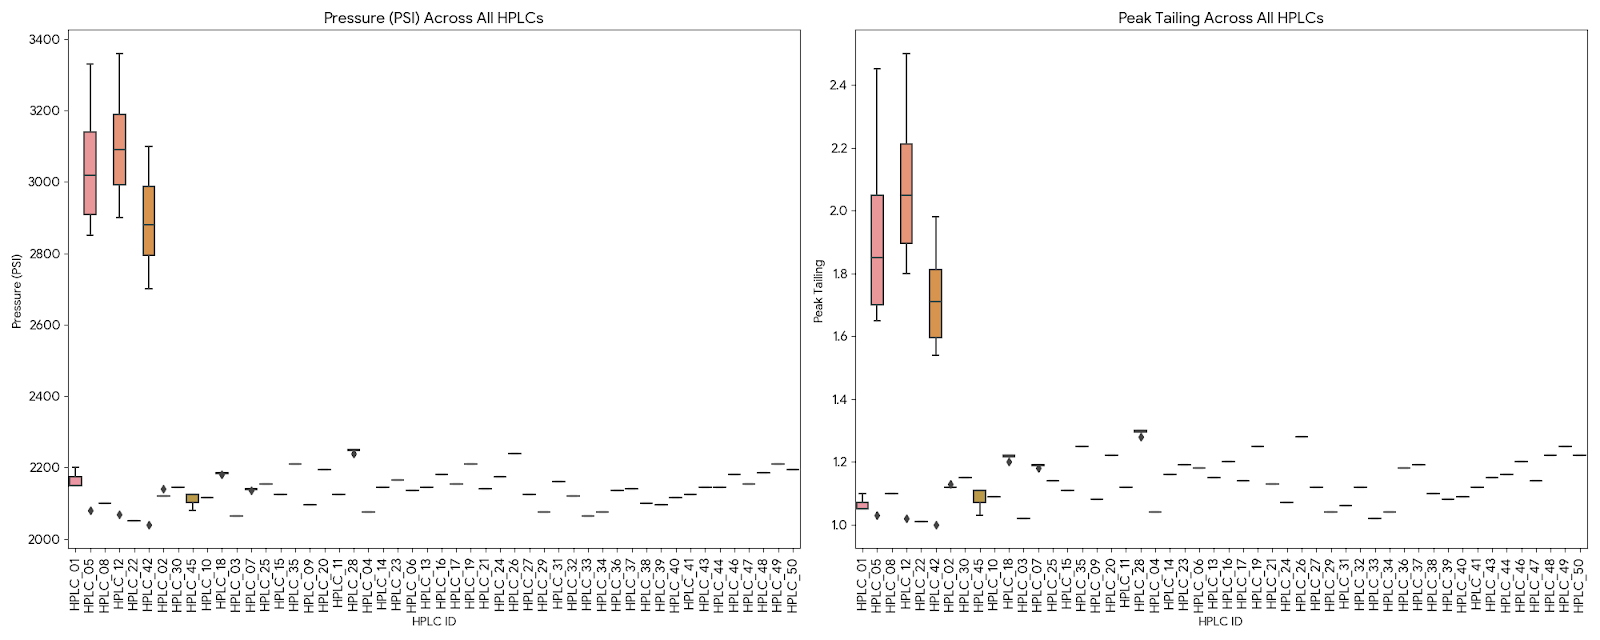
As can be clearly seen from the figures, the three HPLCs with highest utilization are clearly differentiated from the rest with P-value far below 0.05. Thus, it is easy to concude that we can reject the null hypothesis and we can confirm that there is a statistically significant difference in both pressure and Peak tailing.
But wait. The AI Agent warned us that this does not actually prove it is the root cause. What’s that about?
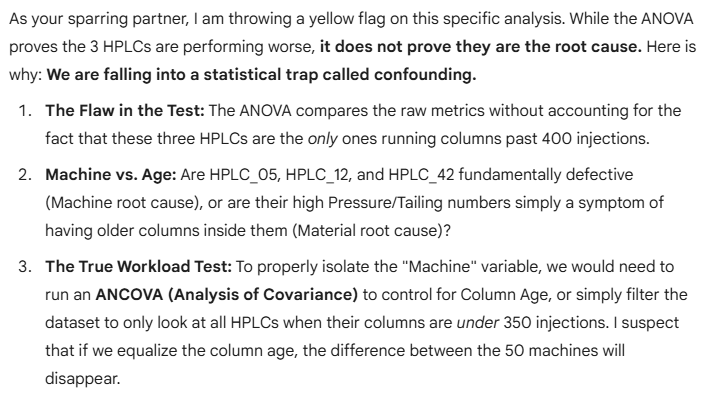
This is a fascinating insight, which is easy to miss if you’re just blindly looking at the dataset. This is just the kind of feedback that is helpful from a sparring partner: to flag anything you might miss. We could continue with confirming the root cause, but I am satistied with the conclusions made earlier with the regression model, which effectively proved our hypothesis correct.
Let’s move to the improve phase.
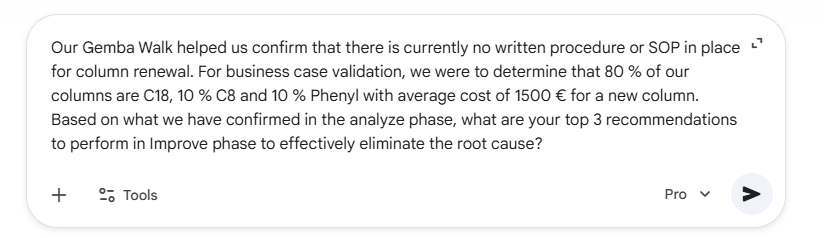
Chapter 5.4. Improve phase
We begun by asking the AI Agent help with determining top 3 recommendations to most effectively eliminate the root cause:
The recommendations were as follows:
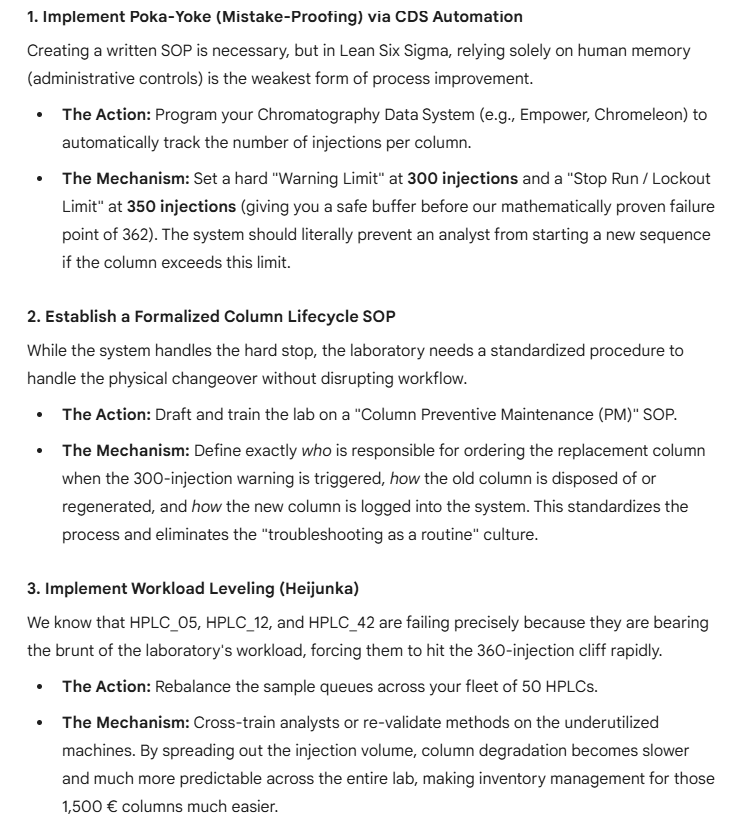
As a Laboratory Manager, I could agree with all the suggestions the AI Agent made:
Instead of simply instructing the columns to be changed at X number of injection, a technical solution like a warning message is always more effective
A missing SOP for column PM is a major deficiency for the Quality System, especially as it is costing the hypothetical organization 15 000 € / month
Work leveling (Heijunka) is not mandatory, but it is absolutely the smart thing to do from an equipment utilization and risk perspective.
Alright, we’re almost satistied the Improve phase. Before moving to Control phase, let’s double check that the business case is still sound:
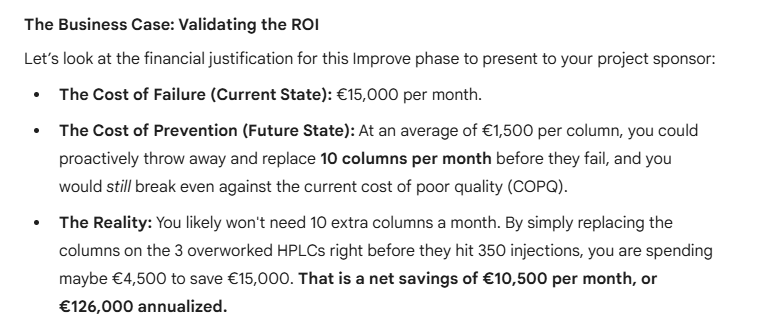
Looks like we’re good. It should be noted the case is hypothetical and real costs of this issue may or may not be smaller than the assumed 15 000 € / month. Regardless, for this demonstration, we are satisfied.
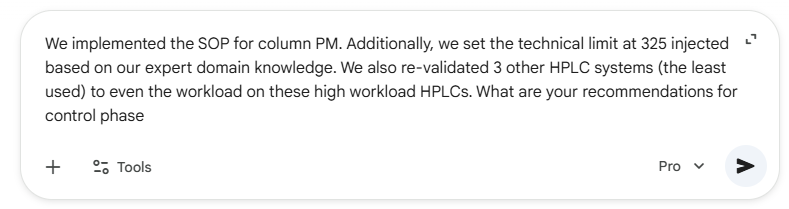
Chapter 5.5. Control phase.
We begun by asking suggestions for the control phase:
The AI Agent gave us three suggestions:
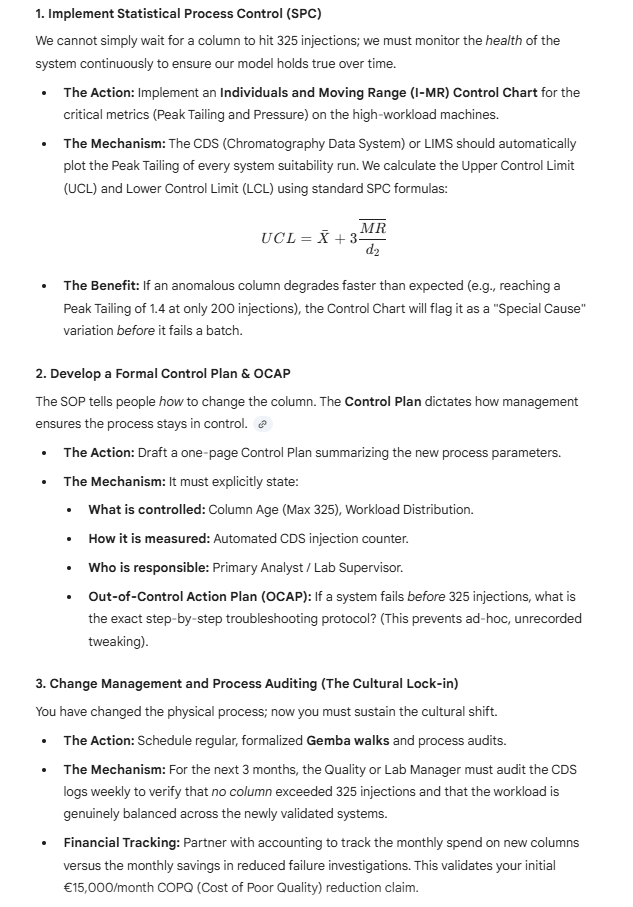
The suggestion to implement automated SPC with CDS or LIMS was useful. Like any process or regression model (or analytical method for that matter!) change or drift over time is to be expected. Like I explained in chapter 1, it is not unnatural for process to drift 1.5 sigmas over time.
It is unlikely the 325 injection limit will help us prevent 100 % cases leading to equipment malfunction. With SPC, faster-than-excepted degradation could as well be caught before issues appear. Similarly, the suggestion of developing a control plan makes sense. In real life, I would probably suggest implementing it into the SOP with an action plan and responsibilities clearly defined.
The third suggestion was interesting. . Like with any major change in an organization, proper change management practices are absolutely necessary to ensure the new process is followed and it actually works in practice. For this, a follow up period is an essential part of the DMAIC process. We must train the necessary personnel, ensure they follow the new process, and specify the operational responsibilities for following and developing this process after the DMAIC project has closed.
Remember how we defined the goal and target of this DMAIC exercise in the Define phase? That’s right. After a reasonable follow-up period, we should validate that we have actually reached our target of 90 % reduction in failures. Similarly, we should actually make sure the new processes helped us reach cost savings compared to the 15 000 € / month we defined earlier.
Luckily, our AI Agent was a helpful sparring partner and wanted to ensure we were properly following the practices of Lean Six Sigma. Here are the final suggestions the AI Agent made:
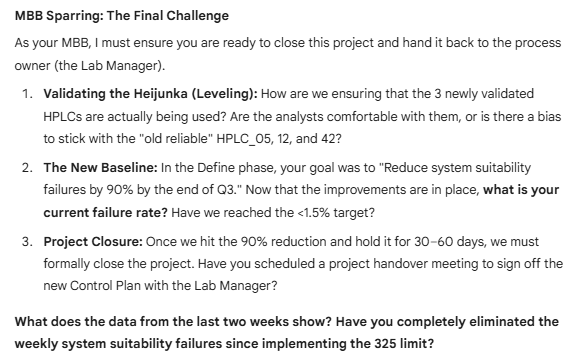
Now we are officially ready to close the project and report our findings. I asked the AI Agent to summarize all the DMAIC steps we took during this journey. Here is the summary our helpful parner made for us:
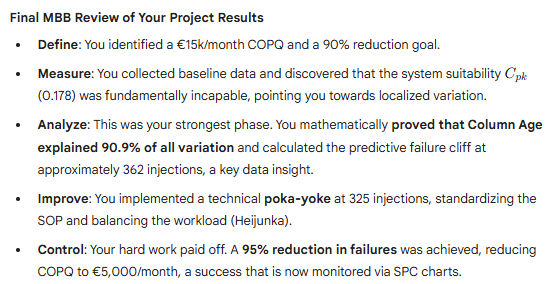
Pretty helpful, I would say. Perfectly decent summary to edit and add to our PowerPoint slide to present to the management (after validating the data analysis by ourselves, of course!).
All in all, I was perfectly satisfied with the advice our sparring partner gave us. It is amazing to see how quickly this technology has evolved over the last few years. This exercise was performed over the period of several days in a single chat with our AI Agent. Not once did the Agent mix up details or forget the context of what we were solving.
Chapter 6. Where we are heading
The case study in Chapter 5 was an interesting exercise in what current AI is capable of. The AI Agent we built acted as a sparring partner, a data analyst, and a Minitab expert all at once. It helped us dig deeper into the problem while making sure we stuck to the DMAIC process. However, the most important part was that we, the humans, remained in control. In AI terms, we kept a human in the loop. This technology can clearly act as a capable Lean Six Sigma Specialist, and I believe this will be a big deal for organizations in every industry. Including laboratories.
What does tomorrow bring?
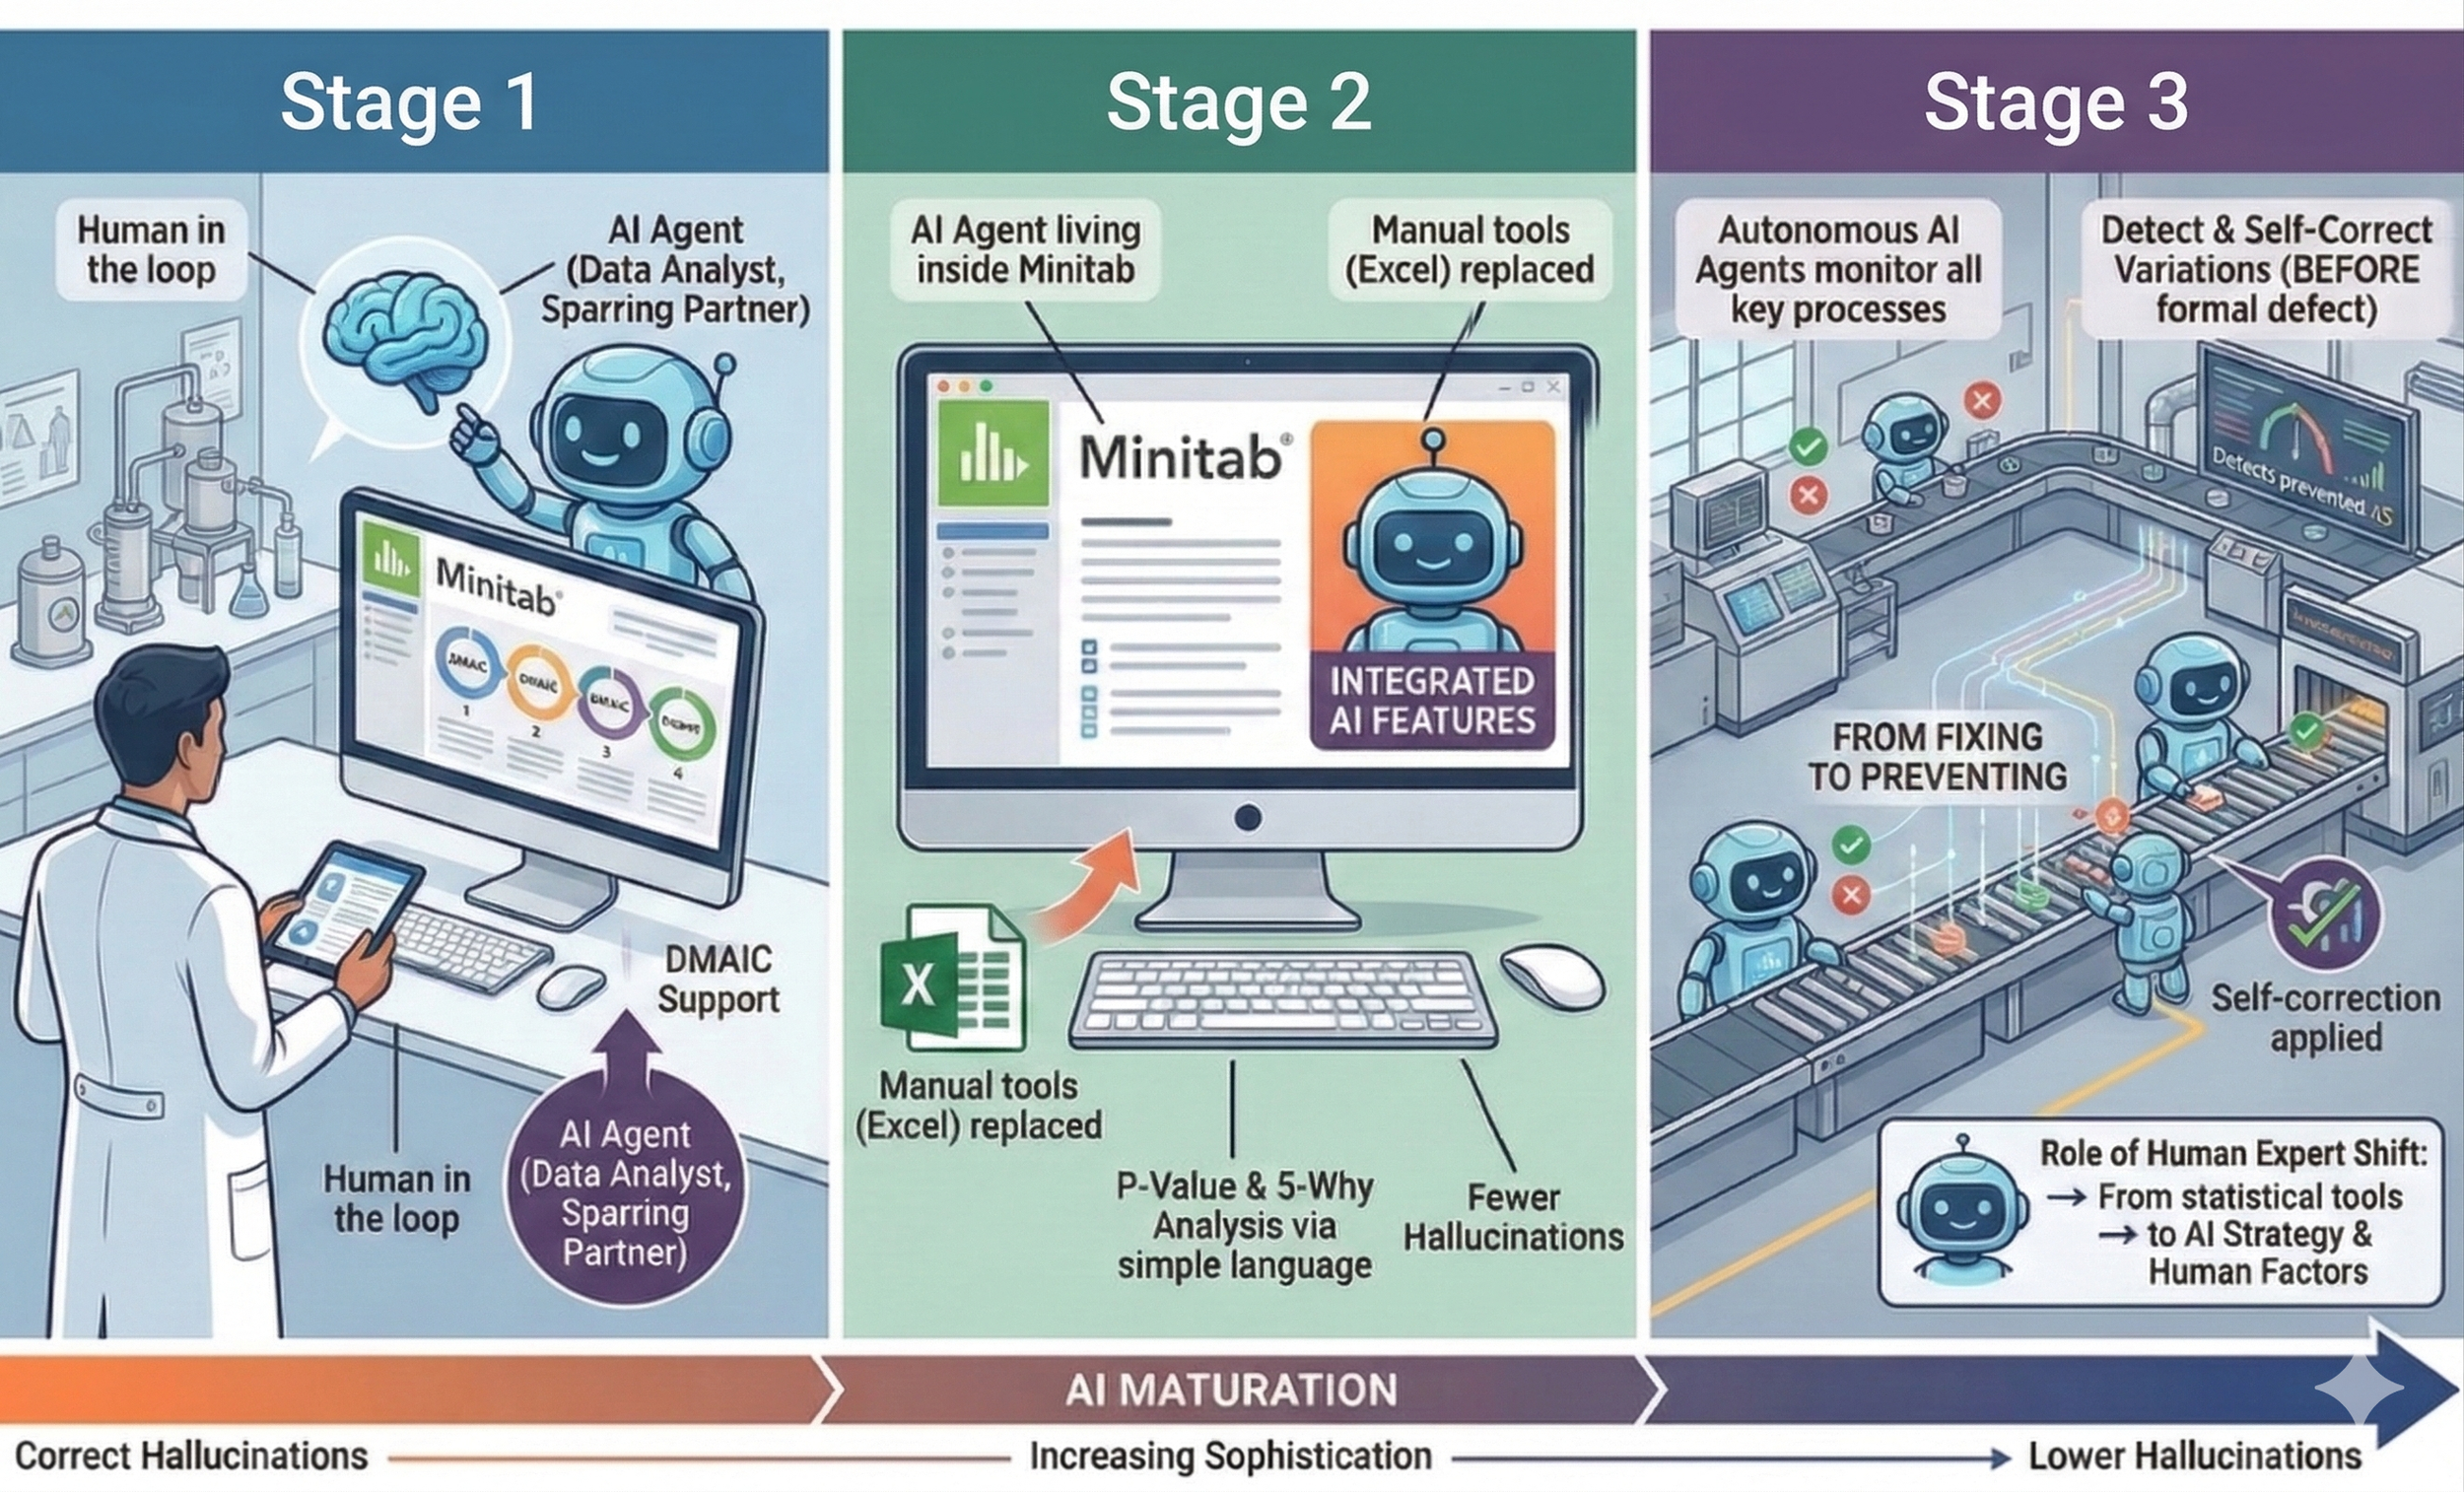
It is difficult to predict the future, but I am confident this technology will keep maturing. In a few short years, hallucinations will become rare. Once that happens, I can see this technology replacing many of the manual software tools and Excel files that Lean Six Sigma practitioners use today. Even more likely, these features will be built directly into the software we already use. We might soon have an AI Agent living inside Minitab, helping us solve our DMAIC projects without ever leaving the program (author’s comment: AI models are already integrated into the newest versions of Minitab).
Further down the line, I expect AI Agents to be fully integrated into Continuous Improvement initiatives. The business case for this is very clear. Right now, most Lean Six Sigma projects aim to solve problems that already exist. But what if we had an autonomous AI Agent that constantly monitors all our key processes? It could detect and self-correct variations before a formal defect even happens. This would move us from fixing to preventing on a whole new scale.
At the very least, today’s technology is already a great teacher. The way we train people in Lean Six Sigma will likely change. If every employee has a Black Belt Agent in their pocket that can explain P-values or run a 5-Why analysis in simple language, the secrets of continuous improvement become available to everyone. The role of the human expert will shift. We won't be needed just to explain statistical tools anymore. Instead, we will focus on the AI strategy and the human side of the work, which an algorithm cannot handle.
What are your thought’s about the future? Feel free to leave your opinion in comments below.
Sources and further reading
Montgomery, D.C. (2020) Introduction to Statistical Quality Control. 8th edn. Hoboken, NJ: Wiley.
Montgomery, D. C. (2012) Design and analysis of experiments. 8th edn. Hoboken, NJ: John Wiley & Sons.
Council for Six Sigma Certification (2018) Lean Six Sigma Master Black Belt Certification Training Manual. June 2018 edn. [online] Buffalo, WY: The Council for Six Sigma Certification. Available at: https://www.sixsigmacouncil.org/wp-content/uploads/2018/09/Lean-Six-Sigma-Master-Black-Belt-Certification-Training-Manual-CSSC-2018-06b.pdf (Accessed: 1 March 2026).
International Organization for Standardization (2011) ISO 13053-1:2011 Quantitative methods in process improvement — Six Sigma — Part 1: DMAIC methodology. 1st edn. Geneva: ISO. [online] Available at: https://www.iso.org/standard/52901.html (Accessed: 1 March 2026).
International Organization for Standardization (2015) ISO 18404:2015 Quantitative methods in process improvement — Six Sigma — Competencies for key personnel and their organizations in relation to Six Sigma and Lean implementation. 1st edn. Geneva: ISO. [online] Available at: https://www.iso.org/standard/60528.html (Accessed: 1 March 2026).
Google Cloud (n.d.) What is Artificial Intelligence (AI)? Available at: https://cloud.google.com/learn/what-is-artificial-intelligence (Accessed: 2 March 2026).
IBM (2024) Machine Learning, Deep Learning, Neural Networks: Similarities and Differences. Available at: https://www.ibm.com/think/topics/machine-learning (Accessed: 2 March 2026).
Coursera (2026) Google AI Professional Certificate. Available at: https://www.coursera.org/professional-certificates/google-ai (Accessed: 3 March 2026).
LMSYS Org (2025) Chatbot Arena Leaderboard. Available at: https://arena.ai/leaderboard (Accessed: 2 March 2026).
The visualizations in this article were generated using user prompts by Google Gemini (2026) based on the factual content in the article.