Chapter 1. Defining Value for your Laboratory Portfolio
In my previous article, I wrote about project management best practices for laboratory projects [1]. To refresh your memory of the basic terminology, I recommend to check it out.
In project management, we’re ensuring we’re doing things right, but with portfolio management, we’re additionally ensuring we are doing the right things. In this article, we will take a systems thinking approact: how to ensure the projects initiated in your laboratory bring value to your organization as a whole with an entire portfolio of projects.
What does a typical laboratory portoflio look like?
No two laboratory portfolios are identical. The structure, scale and focus depends heavily on the size and complexity of your organization as a whole, your industry domain, and the strictness of your quality system. And, of course, your operational budget. Regardless, most laboratory portfolios contain projects in one or all of the following categories:
Equipment acquisition & comissioning: This includes sourcing, qualifying and integrating new analytical instruments or automation technologies into your existing laboratory.
Method development & validation: Developing, transferring and validating analytical methods to support the launch of new products.
Continuous improvement & Lean initiatives: Optimizing your existing process by optimizing analysis throughput, eliminating waste, reducing turnaround time or improving existing analysis methods.
Infrastructure & facilities: Renovating your laboratory layout, relocating a laboratory, or expanding an existing facility to support growth of your business
Digitalization & software solutions: Implementing, updating or validating digital tools, such as LIMS, eQMS, ELNs or other automated processes.
In this article, we will be focusing on an example laboratory fortfolio for a small or medium sized laboratory. In this example, you do not have a separate unit responsible for specified activities, such as method development and validation, or system qualification. Your major internal stakeholders include: QA, calibration & validation, operations, R&D, IT, facility management, finance. While the organizational complexity in a smaller scale of laboratory might sound to be easier to work with, from a laboratory porfolio perspective, it is anything but. In this example, your laboratory leadership is responsible for managing a huge variety of project needs. Resources are few. Timelines are strict. Making an actual impact matters.
In a Lean setting, value is defined by the customer (in our case, its often determined by the recipient of our primary laboratory output, eg., laboratory analyses). To define value accurately, your laboratory leadership must be able to translate stakeholder expectations, and choose projects that are evaluated and prioritized for maximum impact for your organization as a whole, according to your company and business unit strategy. In majority of cases, the workload is much higher than the available resources. Some stakeholders speak louder than others. This is why you need to create a simple yet effective method for scoring your projects before they are added to your laboratory portfolio. My recommendation is to focus on these three criteria:
Strategic alignment: Does this project directly support immediate business goals? (e.g., launching a new product X in Q4, resolve a major audit finding, or enable a 20% throughput increase).
Value-to-effort ratio: How much measurable benefit does this project deliver relative to its complexity and resource strain? Projects with high impact and low complexity should always win over multi-year projects will lots of uncertainty and marginal returns.
Customer value: Will the completion of this project eliminate a constraint in the value stream? (e.g. can QA release more batches, R&D run more projects, customers receive their orders faster). Remember, it is useless to your organization as a whole to improve a process if it doesn’t actually adress the true bottleneck in the organization. Even if you double the speed your laboratory performs its analyses, it doesn’t have business value if the results wait in a queue for them to released by the QA department.
Typical mistakes you can make with your laboratory projects is to focus too narrowly on the localized impact of your project: initiating way too many projects at the same time, unclear benefit to your organization as a whole, deprioritizing projects that have an actual impact. With a portfolio approach, you are forced to evaluate the benefit of your projects as a whole while taking into account all your stakeholders.
In the next chapter, we will be exploring an example of a simple laboratory portfolio. I will be introducing what data you should actually consider to track when designing your portfolio. We will only be focusing on essentials that bring value to your laboratory and stakeholders as a whole in a very Lean manner: no complex tracking systems or waste caused by overly complex tracking.
Chapter 2. Designing And Running Your Laboratory Portfolio
Let’s kick off the chapter by introducing our example laboratory portfolio:
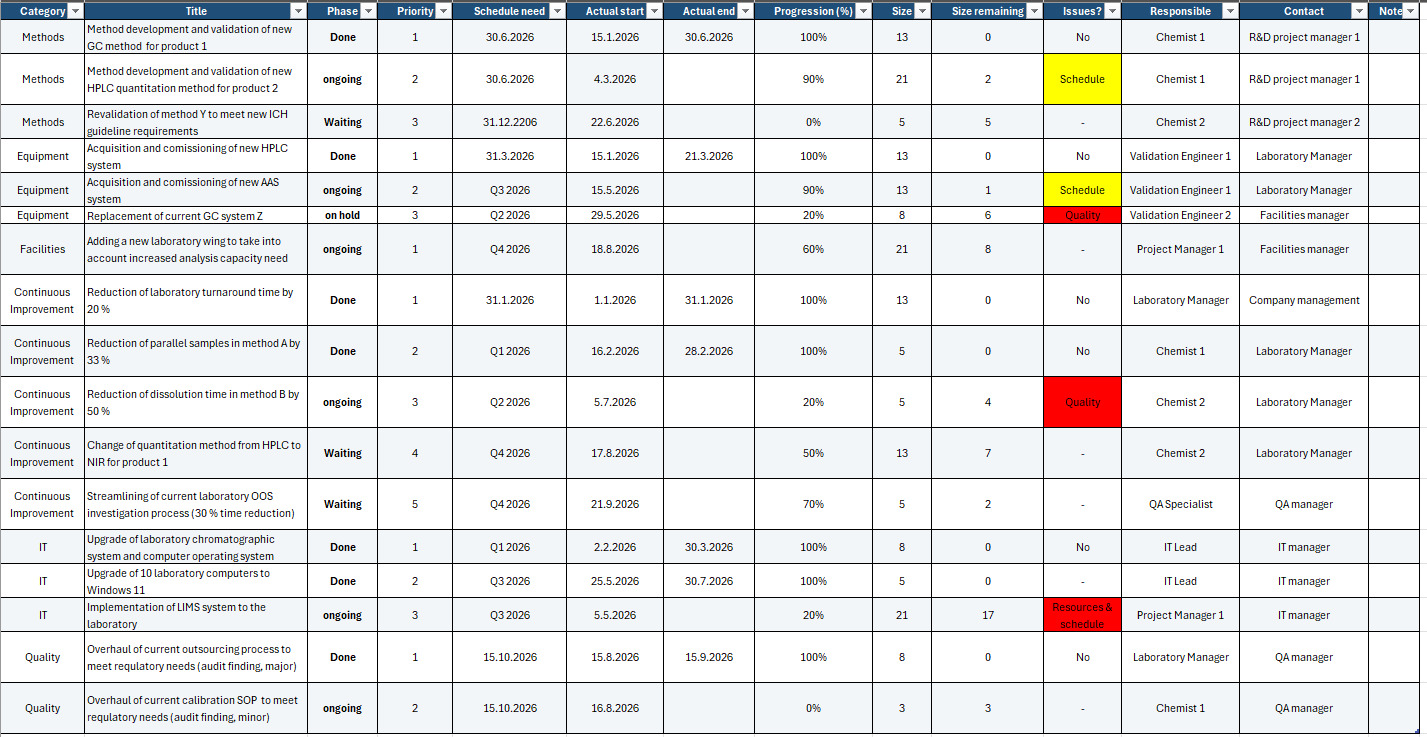
Next, let’s go over what and why we are tracking the categories shown above:
Category: Your projects should be divided into different categories to better recognize resource and stakeholder needs. Generally, you will have certain types of projects, and you want to ensure you don’t commit 100 % of your resources to one type of work, neglecting other needs.
Title: The title of your project. You should ensure the title is sufficiently short, so you don’t mix up different projects.
Phase: This is used to track and control the status of your projects. Generally, you will want to control the number of projects you are running concurrently with the same resources. Only start the next projects, when your resources become available from previous projects (think: Kanban).
Priority: This is done for quick prioritization. In our example, we are tracking the priority of our projects within a single category. This is helpful, because, generally, they are competing with the same resources, and you can easily decide to put some projects on hold within a single category to ensure your top projects are proceeding as the organization needs.
Schedule need: The purpose of this category is twofold. Primarly, it is used to track the actual schedule need of your projects for your organization. This, ideally, will match the schedule you are actually beginning your projects. Secondarily, this is used to ensure you have a plausible amount of projects available within each quarter. Remember, you do not want to overcrowd your laboratory. Running too many projects way over your maximum capacity at the same time will hinder your laboratory portfolio at a whole: your schedules will inevitably be delayed, your personnel will hate their work, and you will end up with less done due to cognitive friction [2] and Little’s Law [3]. Always aim to sequence your activities instead of running them in parallel.
Actual start & end: It’s important to track when you are actually starting and ending your projects. This will ensure you can actually track the projects that are ongoing, and after project completion, it will give you valuable data and insight into how long your projects actually take. Remember: estimates are only as good as your ability to plan and to actually excecute on said plan.
Progression: My preference is to keep the use of this category relatively simple. Your progression estimate should be done by the responsible person of your project, because they will have the best insight into how the project is actually progressing and it will also increase accountability. Your responsibility as the one responsible of running the portfolio is to keep track of your portfolio as a whole, recognize potential issues, and act upon escalation needs your team members raise. In large organizations, you might have processes or even a project management office, and if you do, by all means, utilize it to the fullest. However, in smaller organizations, a simple progression percentage will likely suffice. If you’re spending tens of hours upon designing timelines and tracking their progression in simple projects without actual need for a project manager, whose primary job this is, it translates almost entirely as Waste. Remember, completed projects bring value to your customers and stakeholders, not the non-value adding metawork.
Size & Size remaining: This category links to the point I made in the progression category. My recommendation is to keep this estimation simple: in a small organization, there is no need to perform detailed breakdown of work if you don't have dedicated project managers or the necessary project management training and knowhow. In our example above, you see a popular Agile project management estimation approach: fibonacci sizing. It works by giving your project a number belonging in the fibonacci sequence: 1, 2, 3, 5, 8, 13, 21. The idea is simple: your smallest project should get the smallest number, and your largest project should get the largest number. The idea is not to estimate exact hours, but to create a simple way to compare the relative size of projects across your portfolio. Size remaining then gives you an estimate of how much work is still left, allowing you to see which projects continue to consume significant resources. It will be a useful took keep track of the amount of work currently ongoing in your laboratory (more about this in chapter 3 and 4).
Issues? The point of this category is for your team members to raise any issues and escalation needs during your regular laboratory project meetings.
Responsible: Every project needs someone responsible for the project. You should always name a single person, even if the project might utilize multiple resources. This will ensure accountability and commitment.
Contact: You should also have the contact details of the department or stakeholder primarily needing your project. It might be your R&D project manager, someone from your quality department, or even you as the manager of the team. This will improve communication.
Notes: Projects always have a defined beginning and an end. You should have regular meetings or get togethers with your team where you quickly go over the progression of your projects. With 10-20 projects running simultaneously, it’s impossible for you to keep track of every single project and remember every single key point and issues raised. This is why you should keep a memo or at least short summary of the key points raised during these meetings.
Chapter 3. Running your portfolio and tracking progression
In Chapter 2, we introduced an example laboratory portfolio. Next, I will highlight some important details you should keep in mind when you are actually running your projects.
When should you start planning?
In the Western world, the most common approach is to think in terms of the annual calendar. Typically, this follows the cycle of strategy development and planning for the next year somewhere within Q2–Q4, with the finalized action plan presented to personnel early in Q1. Ideally, you would want to finalize your laboratory project needs and lock in the resources needed before the end of the year. In my opinion, you should start planning for the next year as early as possible, as long as the company and business unit strategies are sufficiently clear.
When planning the projects inside your portfolio, always take into account the availability of resources, how they compete for resources across projects, and realistic schedules. You don’t want a situation where you are running all your projects simultaneously. Instead, you should aim to balance the workload and limit the number of projects being actively worked on at any given time. This is particularly important in a laboratory environment, where the same specialists, equipment, and laboratory facilities are often needed across multiple projects.
Starting too many projects simultaneously can lead to excessive multitasking, frequent interruptions, and delays as people switch between different tasks. Even if everyone appears busy, the actual progress of the portfolio may be slow. This is because starting work on a project does not create value by itself. Value is only created when the project delivers its intended outcome. Therefore, it is often better to complete a smaller number of projects before starting new ones than to have many projects progressing slowly in parallel.
When planning your portfolio, you should also consider dependencies between projects and the specific competencies required to complete each task. For example, if several projects require the same analytical specialist to develop or validate methods, you should not plan these activities as if they could all be completed simultaneously. Instead, consider sequencing the work according to business priorities, resource availability, and the consequences of delaying each project.
Finally, remember that project schedules should be based on realistic estimates rather than optimistic assumptions. Laboratory projects often involve unexpected results, troubleshooting, additional experiments, deviations, or equipment availability issues. Allowing some flexibility in your schedule helps you accommodate these situations without immediately disrupting the entire portfolio. By reviewing resource availability and project priorities regularly, you can adjust the sequence of work as circumstances change.
Let’s imagine your portfolio is up and running. Next, we will focus on how you might track the progression of your laboratory portfolio using the data presented in Chapter 2. For this, my primary recommendation is to utilize common Lean or Agile approaches. For example, by utilizing the columns “Size” and “Size remaining”, you can create a useful burndown or burnup chart [4] to see how you’re actually progressing:
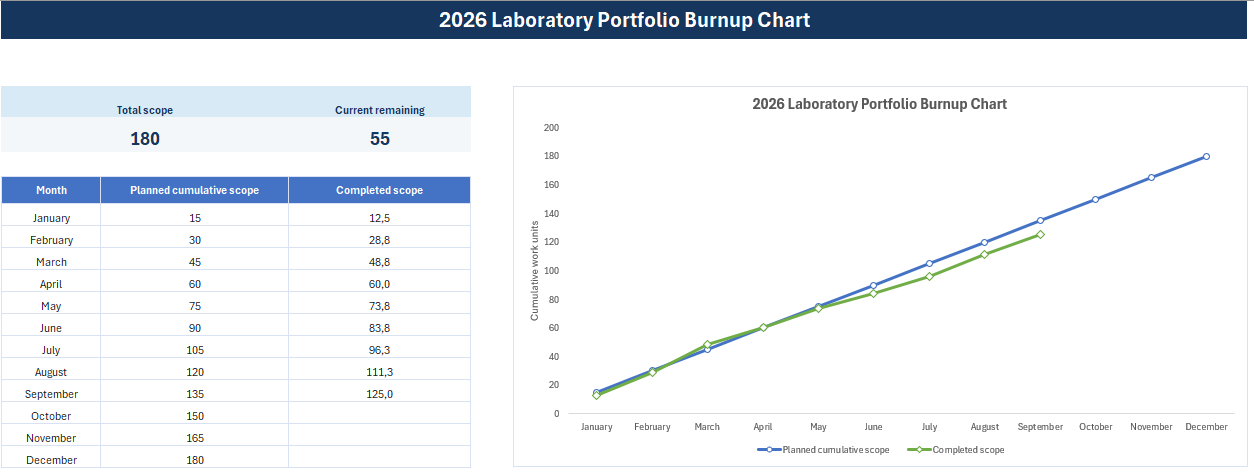
The idea of a burnup chart is to see how your portfolio is progressing against the expected progression. In this example, we have a total portfolio size of 180, so our expected amount of completed work is 15 per month, assuming linear progression. In reality, the progression is unlikely to be completely linear: in the summer months your completion rate will likely stall. You can, of course, plan ahead and focus on completing more work prior to the summer months. To create a burnup chart, you simply need to allocate the expected work across each month of the year, and track the cumulative completed scope for each month. This is an extremely simple way of measuring progress, but it can also be a valuable tool for the person running the portfolio. In this specific example, you can see that at the end of September, you are behind schedule. Actions are needed to get your portfolio as whole back on track.
Let’s dig a bit deeper into our example in chapter 2. We can see three projects that are flagged as red by the person responsible for the project:
Replacement of current GC system Z
Reduction of dissolution time in method B by 50 %
Implementation of LIMS system to the laboratory
In total, the work units remaining would be 6 + 4 + 17 = 27. If these issues were to be solved, your laboratory projects would be back on track. In this way, you know what your manager should be focusing on: performing root cause analysis on the actual issues in these projects. The solution could be negotiating more resources temporarily to crash the schedule, deprioritizing projects withless impact, escalating the quality issues to the QA department, or simply stepping in to help your team to solve the issues present.
As you can see, using fibonacci sizing is extremely easy. It will help you recognize the relative amount of effort needed to complete your projects, but it will also help you plan for the next year: if by the end of the year, you manage to complete 170 work units out of the planned 180, you know it will be likely true the following year also, assuming that the available resources remain the same. This is why a portfolio-based approach matters for running your unit. It helps you create value and focus your attention where it matters, and you will do it in a Lean manner: no waste in added metawork.
Chapter 4. KPIs for a Lean Laboratory Portfolio
The main mission of your laboratory is typically always to provide high quality analysis results on time to your customers. That is why the most common KPIs typically include turnaround time, on-time delivery %, and right-first time %. However, my recommendation is to add a KPI that tracks how well your laboratory is actually executing your business-critical projects. It is typically difficult to find a quantitative way of measuring this, but with the help of portfolio-based approach and the burnup chart we created earlier, it becomes possible.
My suggestion is to utilize a combination of Portfolio Progression % and Project Completion % as the KPI tracking how your portfolio is progressing during the year. Portfolio Progression % tracks how well you are keeping up with doing the amount of work compared to the planned work. Project completion % tracks how many projects you are actually completing in the required schedule. Individually both KPIs have their downfalls: Portfolio Progression % could give you false impression that everything is running smoothly when in reality you have begun the work in all your projects, but you have completed none. Similarly, Project Completion % doesn’t take into account that the progression of completed projects is not linear, nor is the amount of work identical. With monthly tracking, your KPIs might look something like this:
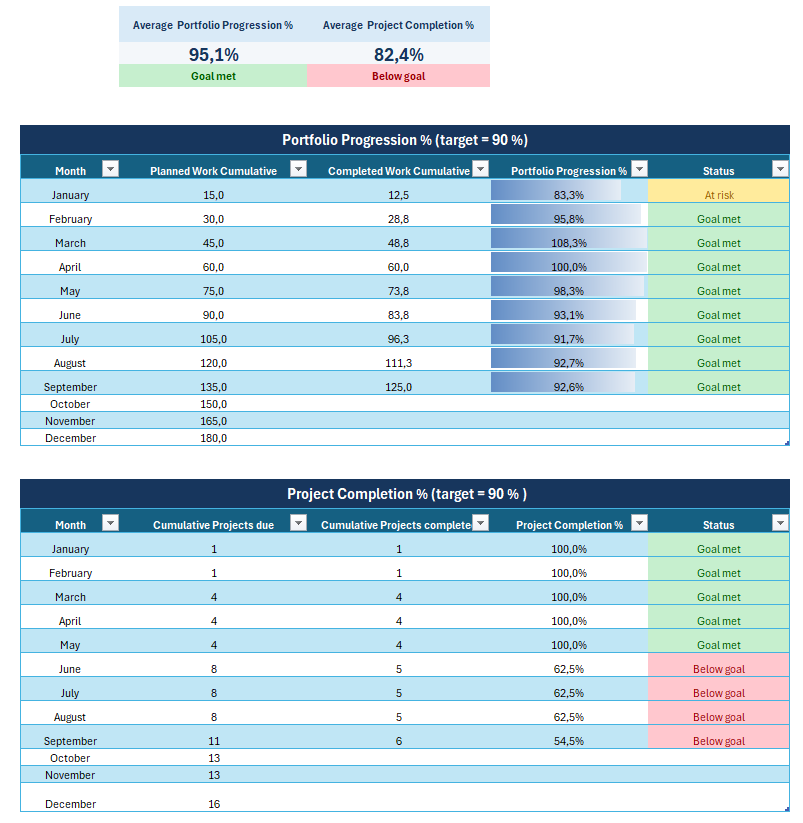
When tracking Portfolio Progression %, you, as the person responsible for the laboratory portfolio, will systematically have to focus on solving the issues raised by the KPI on a monthly basis. Similarly, when tracking Project Completion %, you are forced to focus on actually finishing your projects each month. Remember that Project Completion % requires projects to be completed according to your customers’ needs. When looking at your laboratory portfolio over the course of a year, you can see that we are doing quite well in terms of performing the work required to complete all projects in the portfolio. Average Project Completion %, however, tells a different story. The work is being done, but there are key projects that are running late. Your priority must be to make sure these projects are on track.
There are, of course, many ways of running your laboratory portfolio and tracking how well you are actually doing. This is why my recommendation is to utilize a simplified approach to ensure that no unnecessary work is involved in running the portfolio. In smaller companies or teams, a systematic approach to your laboratory projects might not exist at all. Similarly, even in larger companies, your complex and substantial projects might be included in an official portfolio run by your project management office. That still leaves a dozen or more smaller projects that you are completing during the year, usually without a clear, systematic approach in mind. The approach shown here could be used to manage those projects: your method development or validation projects, your equipment qualification projects, or even your laboratory continuous improvement initiatives.
Sources:
[1] Alanen, O. (2026) ‘Project Management Best Practices for Laboratory Projects’, The Lean Chemist, 15 March. Available at: https://www.theleanchemist.com/blog/project-management-practices-for-laboratory-deliverables (Accessed: 25 October 2026).
[2] Bustos, B., Mordkoff, J. T., Hazeltine, E., & Jiang, J. (2024). Task switch costs scale with dissimilarity between task rules. Journal of Experimental Psychology: General, 153(7), 1873–1886. https://doi.org/10.1037/xge0001598
[3] Alanen, O. (2026) ‘What is Lean?’, The Lean Chemist, 1 March. Available at: https://www.theleanchemist.com/blog/what-is-lean (Accessed: 25 October 2026).
[4] Project Management Institute and Agile Alliance (2017) Agile Practice Guide, page 63, Figure 5-2. Newtown Square, PA: Project Management Institute
