Chapter 1: What is Heijunka?
Heijunka is also known as production smoothing or leveling [1]. It originates from the Toyota Production System and Lean Manufacturing principles, just like many other Lean concepts already introduced in other articles of this blog.
So what is Heijunka?
It follows two major concepts: volume leveling and mix leveling. Volume leveling focuses on spreading your work volume evenly over predefined time buckets based on your average demand. With mix leveling, you sequence different work types into continuous and repeatable patterns throughout your workday or week instead of processing huge single-variant batches. Heijunka is typically combined with other Lean concepts, such as Kanban and visual management, to create a predictable flow of work.
The overall goal of Heijunka is to create a more level and predictable flow of work, supporting Just-In-Time production while reducing the operational effects of uneven demand. Remember one of the central goals of Lean: creating smooth flow while systematically reducing waste and unnecessary variation. To refresh your memory, I recommend checking out my previous article: https://www.theleanchemist.com/blog/what-is-lean.
Why is this concept relevant for QC and analytical laboratories in various industries? In production environments, capacity planning is a major part of production planning. However, in laboratories, the samples are often pushed to the laboratory for analysis. This causes inherent variability for the WIP introduced to the laboratory: one week, your laboratory might only get 30 samples or production batches to analyze. Some other weeks, the amount of samples or batches can easily double. This is especially problematic in environments where your laboratory analyses samples from multiple sites, clients or processes (e.g. QC batches, stability samples, R&D samples, validation samples, customer samples, or other periodic testing samples).
Heijunka is a common Lean concept often utilized in production environments. However, peer-reviewed literature addressing the application of Heijunka to analytical laboratories appears to be relatively limited. This is also why I found writing this article more challenging than the other articles I have written. Nevertheless, there are several successful applications of Heijunka in service industries, including hospitals [2].
Think of it this way: if your production already follows Lean concepts, including Heijunka, with the aim of making its output predictable, stable, and subject to minimal variation, shouldn’t your laboratory also aim for the same? After all, the concept of Lean is universal, and the goal of your laboratory is to provide a service with excellent quality and with a reasonable and predictable turnaround time. Laboratories might not be able to always control when demand arrives, but they can often control when work is released into the analytical process. For those interested in familiarizing themselves with the current state of Heijunka research, I recommend some of the further reading provided in this article, including the excellent review article by Boutbagha et al. (2024).
In Chapter 2, we will look into some concrete examples of how volume leveling and mix leveling might look like in a QC laboratory, including typical challenges laboratories face.
Chapter 2: Why Heijunka matters for analytical laboratories
We already discussed the main challenge most laboratories face in Chapter 1: uneven workload with major spikes (and droughts) in WIP. However, before we get into this, let’s remind ourselves of three sources of inefficiency according to Lean principles and how they might show up in your laboratory:
Mura: Irregular sample arrivals and uncoordinated testing schedules cause uneven work in your laboratory. This shows up as spikes and droughts in your daily demand and WIP.
Muri: Sample spikes force your analysts to multitask and work overtime, which makes your laboratory overburdened. This increases your chance of laboratory errors and is a major source of stress for your personnel.
Muda: Waste can arise from avoidable retesting, unnecessary investigation effort, waiting and rework. Poorly controlled workload peaks may also increase the likelihood of errors that generate additional investigation and rework.
Let’s look at how all this connects to Heijunka by first walking through a possible scenario in an analytical laboratory. This scenario is simplified for illustration purposes. As we all know, real cases are often much more complex:
Your production planning schedule estimation shows that your QC laboratory must test 60 product batches over two weeks to support your release schedule. 45 batches arrive in week 1, and 15 batches arrive in week 2.
Each batch requires three distinct types of testing: (1) HPLC, (2) dissolution, and (3) dimensional testing. The amount of effort needed for these tests is High, Medium, and Low, respectively. In total, our laboratory has 60 HPLC runs, 60 dissolution tests, and 60 dimension checks to complete over two weeks.
This is what your laboratory might look like without Lean concepts and Heijunka in their schedule planning:
Scenario 1: Uneven workload
In week 1, your laboratory prioritizes processing all 45 incoming batches immediately upon arrival. They arrive on Monday, Wednesday, and Friday.
To maximize instrument utilization, your supervisor decides to batch tests by instrument type and run large sample sets to reduce setup time and consumable usage. You first focus on completing the dissolution analyses, followed by HPLC, and finally dimensional testing. In week 2, only 15 batches arrive at the laboratory.
What is the consequence of this type of planning?
In week 1, your analysts face a high and volatile workload. Some may need to multitask or work overtime to keep up with the incoming volume. Under these conditions, the risk of human error and rework may increase. Additional investigation work can then consume capacity that was already constrained by the workload peak.
Meanwhile, waiting for sufficient samples to accumulate before starting an HPLC sequence can create additional WIP. When a large number of analytical results become available at approximately the same time, data reviewers may also experience a workload peak. Similarly, even when the laboratory has completed the analytical work, the batches may still be waiting for data review and subsequent QA disposition.
In week 2, the situation is reversed. The laboratory has considerably less work, leaving analysts and equipment underutilized. The supervisor now has to spend time determining what work can be brought forward or how the available capacity should be used. The problem is therefore not simply that week 1 is busy and week 2 is quiet. The problem is that the workload is unevenly distributed across the value stream.
Scenario 2: Volume and mix leveling:
Let's now consider what the laboratory might look like if we apply volume and mix leveling.
Your 45 samples aren’t processed immediately, but instead are held in a leveling queue. The purpose of this queue is to create a distinction between volatile sample arrival times and the actual execution of laboratory work, assuming you can still meet your turnaround time targets.
You calculate your average daily demand across 10 days: (60 batches / 10 workdays) = 6 batches per workday. Following Heijunka principles, you decide to convert the 45 + 15 batches into predictable packages of 6 batches per day. This is what volume leveling means. For example, three batches could be launched during the morning shift and three during the evening shift, with each batch progressing through its required HPLC, dissolution and dimensional testing.
What is the benefit of doing this?
The workdays of your analysts are predictable, with less overtime in week 1 and being unproductive in week 2.
You utilize your equipment in a steady rhythm with a high utilization rate throughout the two weeks.
Data review workload is distributed evenly, which reduces your turnaround time variance and keeps your overall lead times shorter and more predictable.
Because your flow is standardized, your analysts are less stressed, and it’s unlikely that your laboratory will be swamped with spikes in OOS and laboratory error rates.
Your QA receives a steady flow of batches to release.
To close this chapter, let’s talk about a common mistake many laboratories make, which was also present in Scenario 1: samples are accumulated into large sample sets by waiting several days for more samples to arrive (e.g., waiting until you have a total of 10 samples to run a single HPLC sequence). This may minimize instrument setup times and save consumables, but it focuses on maximizing local efficiency instead of the entire value chain. It creates WIP spikes, bottlenecks in data review and release, and negatively impacts your supply chain's total lead time. Your intention might be good, but it is detrimental to your organization as a whole.
In Chapter 3, we will dig further into Heijunka concepts and how you might tailor these concepts to your processes.
Chapter 3: Applying Heijunka concepts in practice
In Chapter 2, we discussed the typical challenges your analytical laboratory might face by using a simplified example. Reality, however, is often more complex and volatile. As such, it should be noted that not all concepts work in all environments. It is important to tailor any changes you make to meet your unique organizational needs and processes. Regardless, there are certain concepts that are universal. Next, we will go through some of these concepts and how they might be applied in your laboratory.
Modified FIFO scheduling:
The First-In, First-Out principle is a commonly utilized scheduling system [3]. The idea is simple: you analyze your samples based on the order of their arrival. This will generally ensure fairness and support a predictable turnaround time for your analyses. However, the flaw in blindly following the FIFO principle is that it ignores sample criticality and bottlenecks (e.g., not all your analysts can run every analysis type).
This is why FIFO queuing should also include prioritization based on your corporation’s batch release date schedule (customer need). This means that your laboratory’s visual management system should include a must-start date based on this release schedule. It should be incorporated into your workload planning when deciding the order of your daily Heijunka packages.
Your FIFO queuing system should also include any major constraints your laboratory might have. This may include knowing any limitations in equipment, analyst qualifications, or perhaps even the availability of fume hoods for sample preparation. Process knowledge is essential, so tailor your approach accordingly.
Once your daily Heijunka packages are released to the laboratory, your analysis FIFO queue order should be followed to the letter. Cherry-picking of easier and faster analyses should not be allowed.
Rhythm Wheels:
A Rhythm Wheel is a Lean concept that executes a repeating, fixed sequence of product runs to keep production predictable while smoothing out demand. It balances inventory levels against setup costs by optimizing changeover order and scaling each run's duration based on real customer demand [4]. The idea of a rhythm wheel in an analytical laboratory is simple: you should plan your weekly schedule by allocating standard testing activities in a fixed, recurring manner (e.g., 1-week or 2-week intervals).
Let’s assume 80% of all the analyses your laboratory performs belong to these categories: HPLC, GC, Dissolution, Mechanical testing, and UV-VIS.
One type of implementation method could be to allocate specific, recurring days of the week when certain types of analyses are performed (e.g., Dissolution on Monday, Wednesday, and Friday).
Creating a fixed schedule works when your workload is routine and has low volatility. It helps make your process more predictable, and set schedules will reduce the mental load of your laboratory analysts. However, this also makes your process more rigid: prioritization needs might not be met, and it requires you to have unallocated capacity in your laboratory to fully absorb any spikes in WIP.
In a complex environment, a rhythm wheel by itself is not enough due to its inflexibility. This is why a more complex but standardized system is needed. A typical example in a laboratory setting would be to standardize all your repeating test sequences. This sequence might look as follows:
Sample preparation
Dissolution
Analysis and run
Documentation and reporting
Data review
You could initiate this sequence when a set volume or amount of batches are accumulated in your analysis queue. Or alternatively, the sequence is initiated when your scheduling system indicates that the must start date is met as a part of your modified FIFO system (for your batch to meet your laboratory's target schedule or customer demand).
Applying the concepts in practice:
Let’s focus on the example shown in Chapter 2, with 45 samples arriving in week 1 and 15 samples in week 2. In this example, we will apply all the concepts introduced previously.
Based on our laboratory capacity, we decided to follow a daily testing package of 6 batches. Let’s assume our example of dissolution and dimensional testing can be completed during a single day. HPLC analysis requires the first day for sample prep and for your sample to be fully dissolved. The analysis runs overnight, and data collection and reporting are performed the next morning. Our laboratory works in two shifts: morning and evening. Both the analysis capacity and data review capacity of our laboratory are taken into account.
We begin by dividing our testing capacity into a morning and evening set.
Morning set A:
3 HPLC runs: sample preparation, sample dissolving, and setting the instrument up for a run overnight.
3 Dissolution tests: completed during the morning shift.
3 dimensional tests: completed during the morning shift.
Evening set B:
3 HPLC runs: Sample preparation, sample dissolving, and setting the instrument up for a run overnight.
3 Dissolution tests: completed during the evening shift
3 dimensional tests: completed during the evening shift
For the sake of this example, let’s assume we have performed a major process optimization of our HPLC method to support rapid analysis. This is also why it’s essential to reduce the number of batches your analysts work on simultaneously. By working in two shifts, the analysts in the evening shift can support the analysts working in the morning shift (e.g., preparing or collecting flasks, consumables, documentation templates, instructions) and vice versa.
Our data review cycle is similarly optimized as follows:
Morning review set A:
Reviewing data from last night’s overnight HPLC runs (both morning set A and B).
Initiating OOS investigations immediately upon discovery from overnight HPLC runs.
Continuing OOS investigations from evening review set B (dissolution and dimensional testing)
Evening review set B:
Reviewing data from current day’s completed dissolution and dimensional testing.
Initiating OOS investigations upon discovery from current day’s dissolution and dimensional testing
Continuing OOS investigations from morning review set A HPLC runs
You should note that the workloads from review sets A and B are not equal: HPLC runs will likely require more capacity due to the complexity of the analyses. Plan accordingly. With a standardized system following Heijunka principles, the flow of your batches should be more even in your laboratory, and your turnaround time more predictable.
Chapter 4. How do you know if Heijunka is actually working?
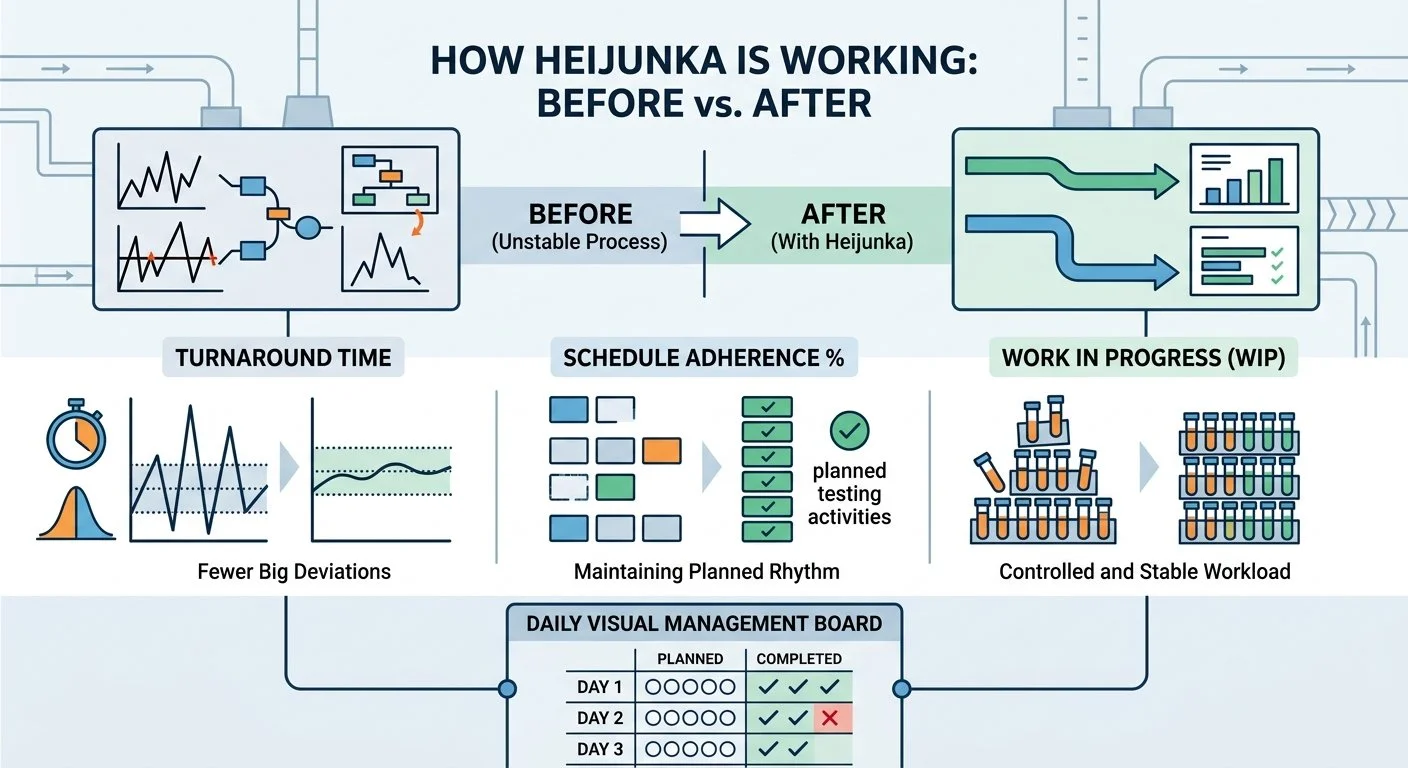
Whenever you make a significant change to your laboratory processes, you should perform a before-and-after comparison to determine whether the change is delivering the intended benefits. For Heijunka, I recommend focusing on three key metrics:
Turnaround time: When applying Heijunka, you should expect an improvement in the stability and predictability of your turnaround time. By creating standard work packages, your turnaround times should become more predictable, with large deviations between batches occurring less frequently. Following only your mean or median is not enough, as process variation can easily be masked by averages. This is why I recommend setting up an Individuals-Moving Range (I-MR) control chart, which can be useful for visually tracking whether process variation is changing over time. This will help you determine whether Heijunka is providing a more predictable service to your customers.
Schedule adherence %: This is the percentage of planned testing activities (your batches) completed within the scheduled time window. If your laboratory plans to analyze and review six batches per day, the schedule adherence KPI tells you how consistently you can maintain this planned pace. Consistently high schedule adherence indicates that your workload packages are realistic and that your laboratory can maintain the intended rhythm. Conversely, repeated deviations from the plan may indicate capacity constraints, equipment bottlenecks, unrealistic workload assumptions, or other disruptions to the process.
WIP: As the objective is to create a controlled and predictable flow of work, you should track your total laboratory WIP. I also recommend breaking WIP down by process step, such as the leveling queue, sample preparation, analysis, data review, and OOS or laboratory error investigations. Remember that the leveling queue is not additional WIP. It is simply one component of your total laboratory WIP. The purpose of a leveling queue is to act as a controlled buffer between variable sample arrivals and the planned release of work into the analytical process. The goal is therefore not necessarily to eliminate the queue, but to keep it controlled and prevent it from developing into an ever-growing backlog.
There are, of course, several other metrics you could use to evaluate the impact of Heijunka. However, these three provide a useful starting point because they measure different aspects of the system. WIP tells you whether the workload is controlled, schedule adherence tells you whether the laboratory can maintain its planned rhythm, and turnaround time tells you whether this translates into predictable service for your customers.
For real-time tracking, you could create a simple visual management board showing whether your laboratory has actually completed its planned workload each day. With six daily Heijunka packages, you could visualize the number planned against the number actually completed. This information should be reviewed daily because it allows laboratory management to react quickly when the process deviates from the plan.
Sources
[1] Lean Enterprise Institute (n.d.) Heijunka. Available at: https://www.lean.org/lexicon-terms/heijunka/ (Accessed: 9 August 2026).
[2] Boutbagha, M. and El Abbadi, L. (2024) 'Heijunka-levelling customer orders: a systematic literature review', International Journal of Production Management and Engineering, 12(1), pp. 31–41. Available at: https://www.researchgate.net/publication/376247758_Heijunka-levelling_customer_orders_a_systematic_literature_review. Accessed: 29 August 2026.
[3] Lean Enterprise Institute (n.d.) First In, First Out (FIFO), Lean Lexicon. Available at: https://www.lean.org/lexicon-terms/first-in-first-out-fifo/. Accessed: 29 August 2026.
[4] Francas, D. and Packowski, J. (2013) 'LEAN SCM: A paradigm shift in supply chain management', Journal of Business Chemistry, October (Practitioner's Section). Available at: https://www.businesschemistry.org/article/lean-scm-a-paradigm-shift-in-supply-chain-management. Accessed: 29 August 2026.
The visualizations in this article were generated using user prompts by Google Gemini based on the factual content in the article.
